
Image
|
Figure Caption
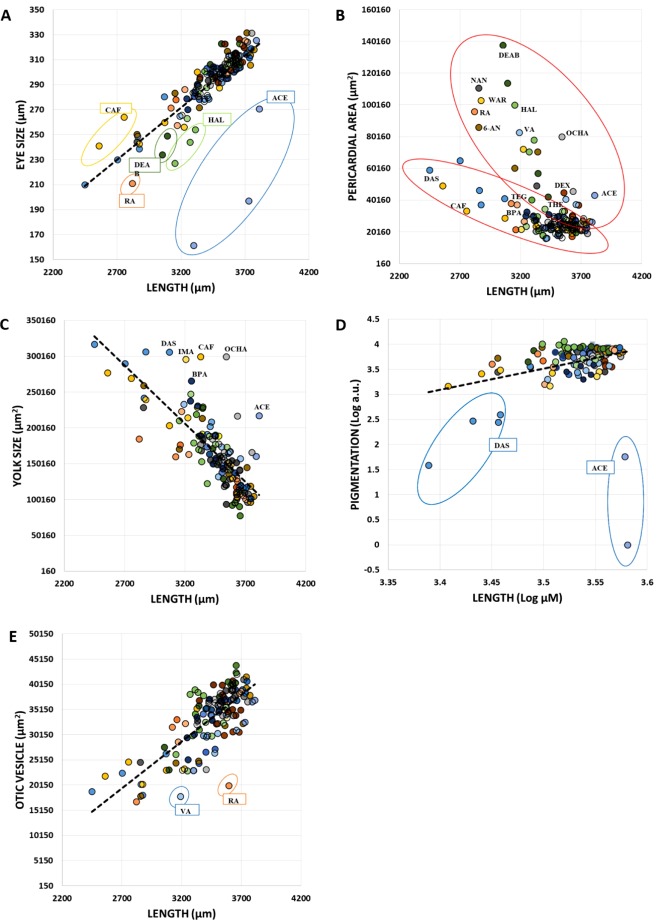
Fig. 3 Fig. 3. Correlation between the different size-based phenotypes, and identification of compounds with potential specific mode of action. (A) Body length vs eye size, (B) body length vs heart edema, (C) body length vs yolk size, (D) body length vs pigmentation and (E) body length vs otic vesicle. Each dot represents the mean of the population for each concentration. Notice that units in (D) are expressed in logarithmic scale for better clarity.
Acknowledgments
This image is the copyrighted work of the attributed author or publisher, and
ZFIN has permission only to display this image to its users.
Additional permissions should be obtained from the applicable author or publisher of the image.
Reprinted from Reproductive toxicology (Elmsford, N.Y.), 96, Jarque, S., Rubio-Brotons, M., Ibarra, J., Ordoñez, V., Dyballa, S., Miñana, R., Terriente, J., Morphometric analysis of developing zebrafish embryos allows predicting teratogenicity modes of action in higher vertebrates, 337-348, Copyright (2020) with permission from Elsevier. Full text @ Reprod. Toxicol.