
- Title
-
Diverse species-specific phenotypic consequences of loss of function sorting nexin 14 mutations
- Authors
- Bryant, D., Seda, M., Peskett, E., Maurer, C., Pomeranz, G., Ghosh, M., Hawkins, T.A., Cleak, J., Datta, S., Hariri, H., Eckert, K.M., Jafree, D.J., Walsh, C., Demetriou, C., Ishida, M., Alemán-Charlet, C., Vestito, L., Seselgyte, R., McDonald, J.G., Bitner-Glindzicz, M., Hemberger, M., Rihel, J., Teboul, L., Henne, W.M., Jenkins, D., Moore, G.E., Stanier, P.
- Source
- Full text @ Sci. Rep.

ZFIN is incorporating published figure images and captions as part of an ongoing project. Figures from some publications have not yet been curated, or are not available for display because of copyright restrictions. PHENOTYPE:
|
|
ZFIN is incorporating published figure images and captions as part of an ongoing project. Figures from some publications have not yet been curated, or are not available for display because of copyright restrictions. PHENOTYPE:
|
|
ZFIN is incorporating published figure images and captions as part of an ongoing project. Figures from some publications have not yet been curated, or are not available for display because of copyright restrictions. PHENOTYPE:
|
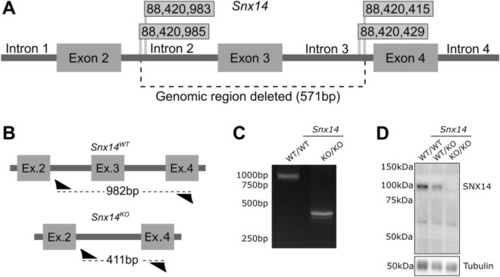
Generation of Snx14 mutant mice. ( |
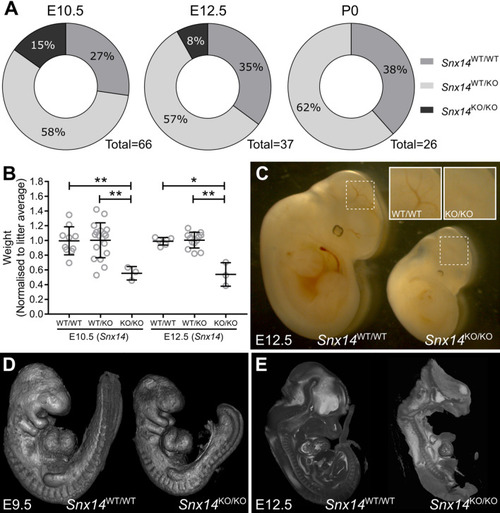
Homozygous |
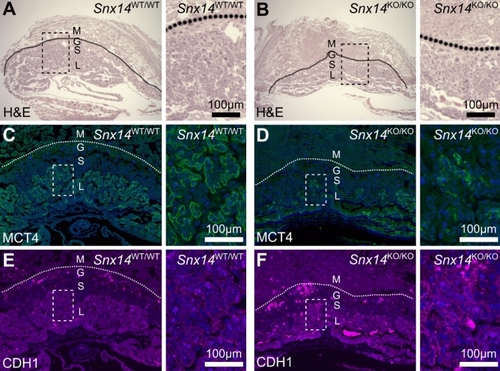
Homozygous |
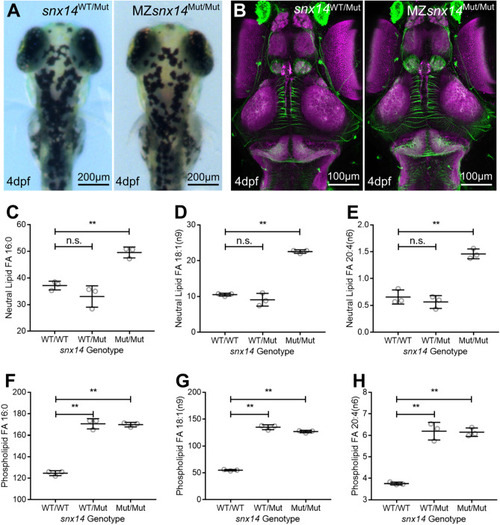
Constitutive homozygous |