FIGURE SUMMARY
Title

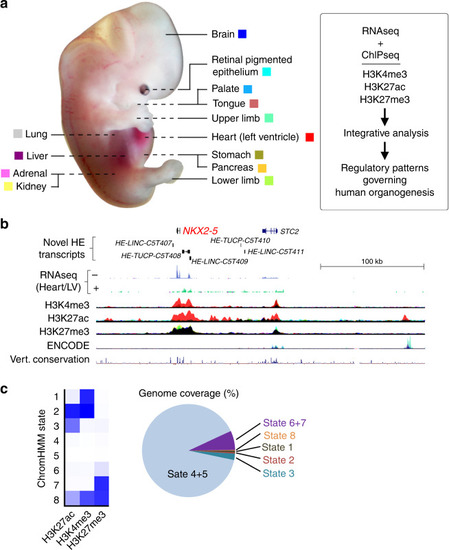
Dynamic changes in the epigenomic landscape regulate human organogenesis and link to developmental disorders

Authors
Gerrard, D.T., Berry, A.A., Jennings, R.E., Birket, M.J., Zarrineh, P., Garstang, M.G., Withey, S.L., Short, P., Jiménez-Gancedo, S., Firbas, P.N., Donaldson, I., Sharrocks, A.D., Hanley, K.P., Hurles, M.E., Gomez-Skarmeta, J.L., Bobola, N., Hanley, N.A.
Source
Full text @ Nat. Commun.

Epigenomic landscape across 13 human embryonic tissues.

a Thirteen different human embryonic sites were sampled for RNAseq15 and ChIPseq, as described in the “Methods” and in Supplementary Data 1 and 2. The same colour coding for each tissue is applied throughout the paper in overlaid ChIPseq tracks. The heart (left ventricle) dataset is summarised as Heart/LV from hereon. b 300 kb locus around the NKX2-5 gene, the most discriminatory TF gene for human embryonic heart15. The locus contains five unannotated human embryonic (HE) transcripts enriched in heart [three LINC RNAs and two transcripts of uncertain coding potential (TUCP)]. Heart/LV-specific (red) H3K4me3 and H3K27ac marks were detected at the NKX2-5 TSS and adjacent transcripts (HE-TUCP-C5T408 and HE-LINC-C5T409). Embryonic heart-specific H3K27ac marks were visible up to 200 kb away (e.g., at the extreme right of panel). H3K27me3 marked the region from NKX2-5 to HE-LINC-C5T409 in all non-heart tissues (the track appears black from the superimposition of all the different colours other than red). ENCODE data are from seven cell lines26. c Genome coverage by ChromHMM for the different histone modifications was similar across all tissues (Supplementary Fig. 1) with an average 89.8% of the genome unmarked (range: 81.7–94.0; States 4 & 5), and 3.3% consistent with being an active promoter and/or enhancer (range: 1.7–6.1; States 1–3).

Classification of major promoter states.

a Clustered heatmaps surrounding the transcriptional start sites (TSS + /− 3 kb) of 19,791 annotated genes. The example shown is for adrenal. One replicate is shown for each data type for simplicity. Replicates across all tissues were near identical. Two minor variations on this pattern were detected in RPE (Supplementary Fig. 2) and the liver, lung and brain (Supplementary Fig. 3). b Mean signal levels for the genes clustered in (a). Traces are coloured according to the text colour in (a). Broad expressed genes show approximately double the level of transcription and twice the width of H3K4me3 and H3K27ac marks compared with narrow expressed genes.

Integration of promoter states across tissues and over time.

a Alluvial plot showing promoter state for 19,791 annotated genes across all tissues with replicated datasets. To aid visualisation, all the different transcribed states are amalgamated into a single expressed category (the alluvial plot for all individual states is shown in Supplementary Fig. 6). The example shown is centred on the promoter state in the Heart/LV dataset. Those genes with an expressed promoter state in the heart and either active repression or inactive elsewhere are indicated to the right of the panel and subject to gene enrichment analyses in (b). b Gene enrichment analysis of genes with an expressed promoter state in the heart and either active repression or inactive in all remaining tissues. All remaining genes were used as background. Examples of the genes underlying the biological process (BP) or disease ontology (DO) terms and their total number are listed beneath the bar charts. c Alluvial plot showing the variance in promoter state between H1 human pluripotent stem cells (hPSCs), the embryonic pancreas (prior to endocrine differentiation24) and the adult pancreas. Circles capture those genes that shift from active repression to expressed at the stage of either embryonic or adult pancreas. d Gene enrichment analyses of encircled genes from (c). Examples of the genes underlying the BP and KEGG terms and their total number are listed beneath the bar charts. All remaining genes were used as background. While maturity onset diabetes of the young emerged in both analyses, the underlying genes were different reflecting developmental roles prior to or after pancreatic endocrine differentiation24.

Transgenic analysis of H3K27ac regions from human embryonic tissues.

H3K27ac-marked regions were tested in multiple lines of stable transgenic zebrafish (details in Supplementary Data 4; same colour coding of tracks as in Fig. 1). a 231 bp limb enhancer, 502 kb downstream of TBX15, with the corresponding green fluorescent protein (GFP) detection in fin bud at 48 h post fertilisation (hpf). b About 355-bp heart/LV enhancer, 189 kb upstream of HEY2, with the corresponding ventricular GFP detection at 48 hpf. c 1.5 kb palate enhancer, 141 kb downstream of ALX1, with GFP in the developing trabecula and mandible (blue arrows) at 48 hpf. Correlations between the enhancer and transcription of the TF gene are shown for each example. Note the H3K27me3 marks over the gene in each instance in other tissues. *, midbrain GFP expression from the integral enhancer in the reporter vector used as a positive control for transgenesis.

Patterns of enhancer activity and transcription factor binding across tissues.

a Elbow plots for each histone modification following allocation of the genome into 3.1 million consecutive bins of 1 kb. The example shown is for adrenal providing the number of reads per bin at the point of maximum gradient change (the elbow point, red dot) and a quantitative measure of whether a bin was marked or not (e.g., >10 or <10, respectively, for H3K27ac). Converting marks into a binary yes/no call at any point in the genome facilitated the data integration across the different tissues. While the number of reads per bin at the elbow point was different for each mark across the tissues, the shape of the curve remained the same. b Euler grid for bins marked by H3K27ac (defined by elbow plots) in replicated tissues (i.e., two rows/replicates per tissue). Total number of marked bins per individual dataset is shown to the right. The example in (b) required a bin to be called in any two or more samples and is ordered by decreasing bin count per pattern (bar chart above the grid). A total of 48,570 different patterns were identified, of which the top 40 are shown. Tissue specificity for all sites emerged in the top 265 (0.5%) patterns; colour-coded asterisks above columns). For example, nearly 14,000 bins marked only in the two Heart/LV H3K27ac datasets ranked first as the most frequent pattern. The seventh most frequent pattern in ~3000 bins was palate-specific. Tissue-specific patterns were far less apparent at promoters (H3K4me3, n = 18,432; Supplementary Fig. 10) or for H3K27me3 (n = 26,339; Supplementary Fig. 11). While patterns across multiple tissues were permitted by stipulating marks in ≥2 samples (e.g., heart and adrenal in column 24), they could be enforced by stipulating marks in at least four samples (Supplementary Fig. 12). c Enrichment of known TF-binding motifs in the tissue-specific patterns of H3K27ac identified in (b). Five individual tissues are shown as examples alongside analysis of the shared regulatory pattern identified for the limb and palate identifying marked enrichment of a compound PITX1:E-box motif. Motif-enrichment was conducted using a one-sided Binomial test implemented in findMotifsGenome.pl of the HOMER package.

Overlay of non-coding de novo mutations linked to developmental disorders.

a The Deciphering Developmental Disorders (DDD) study included 6139 non-coding regions in its sequence analysis of trios comprising affected individuals and unaffected parents2,32. These non-coding regions were selected on the basis of high sequence conservation (ultra-conserved elements, UCEs, n = 4307), experimental validation (experimentally validated enhancers, EVEs, n = 595) or identification as a putative heart enhancer (PHE, n = 1237). Overlap with any H3K27ac, H3K4me3 or H3K27me3 1 kb bins is shown as an aggregate and for each individual category (UCE, EVE or PHE). b Equivalent overlap is shown for the 739 regions in which disease-associated de novo mutations (DNMs) were identified. c In total, 46% of DNM-positive regions were situated (+/− 1 kb) in at least one tissue-replicated H3K27ac and/or H3K4me3 bin. Over half of the disease-associated overlap was covered by the heart/LV (35%) and brain (18%). 75% of the disease-associated PHE regions were situated within 1 kb of a heart/LV-specific histone mark. d Enrichment in the number of DNMs overlapping (+/− 1 kb) H3K27ac marks during human organogenesis for individuals with neurodevelopmental (n = 671 cases), cardiac (n = 124 cases), limb (n = 312 cases) and eye (n = 288 cases) phenotypes. The circles represent the observed/expected ratio with asymmetrical error bars showing the 95% confidence limits calculated for a Poisson distribution (http://ms.mcmaster.ca/peter/s743/poissonalpha.html). For the neurodevelopmental phenotypes, this included analysis against DNAse hypersensitivity data and H3K27ac data from second trimester fetal brain10.

Neurodevelopmental de novo mutation within brain-specific histone modification correlated to surrounding gene expression.

An intergenic G-to-T de novo mutation (DNM; hg38, chr16:72427838) is shown for a patient with a neurodevelopmental phenotype. Tracks are shown demonstrating additional human embryonic non-coding transcription (enriched in human embryonic brain), the three epigenomic marks, ENCODE data26 and conservation amongst vertebrates. The DNM overlaps a brain-specific (dark blue) H3K27ac and small H3K4me3 mark. The highest correlations are shown, notably to the promotors of ZNF821 (r = 0.92) (dark blue) with anticorrelation (r = −0.65, red) to the adjacent gene, ATXN1L.

Deletion of enhancer upstream of <italic>RBM24</italic> disrupts cardiomyocyte differentiation.

a Schematic of a 2.4 mb locus on chromosome 6 containing eight protein-coding genes centred on a cardiac-specific H3K27ac peak (red, broken line box) within the last intron of ATXN1. This enhancer harbours a DNM from the DDD cohort associated with congenital heart disease2. The histone modification tracks contain datasets from all the colour-coded tissues. b Fold enrichment in the heart/LV dataset compared with the average across all other tissues for RNAseq read counts of the genes shown in (a). RBM24 and CAP2 are considerably enriched in the human embryonic heart. c Magnified schematic of the enhancer shown in (a) showing the location of the DNM and the CRISPR-Cas9 approach for deletion. d EBs from wild-type and enhancer deletion (mutant) hPSCs containing the NKX2-5-GFP reporter. The images showing nine EBs for wild-type and mutant are after 14 days of the cardiomyocyte differentiation protocol34,35. Size bar, 500 μm. e Box and whisker plot (box showing 25th−75th percentile and median line with min–max as whiskers) quantifying GFP across all wild-type (n = 29) and mutant EBs (n = 30). f RT-qPCR for expression of all the protein-coding genes across the 2.4 mb locus depicted in (a). Ten different clones were used in three independent experiments for mutant EBs with ten, ten and nine clones for wild-type control. Error bars represent S.E.M. from the three independent differentiation experiments (the individual dots). Time points for RT-qPCR were day 0 (undifferentiated hPSCs) and day 14 (cardiomyocyte progenitors34,35). While CAP2 expression appeared reduced, RBM24 was the only gene with significantly lowered expression following deletion of the cardiac-specific enhancer shown in a). Significance was assessed using a two-tailed Student’s t test (ns, not significant).

Acknowledgments
This image is the copyrighted work of the attributed author or publisher, and ZFIN has permission only to display this image to its users. Additional permissions should be obtained from the applicable author or publisher of the image. Full text @ Nat. Commun.