FIGURE SUMMARY
Title

The Role of Methionine Aminopeptidase 2 in Lymphangiogenesis

Authors
Esa, R., Steinberg, E., Dror, D., Schwob, O., Khajavi, M., Maoz, M., Kinarty, Y., Inbal, A., Zick, A., Benny, O.
Source
Full text @ Int. J. Mol. Sci.

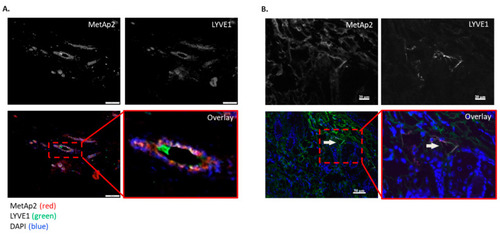
Cancer tissue samples retrieved from two breast cancer patients express MetAp2 and LYVE1. (A,B) Immunofluorescence staining of MetAp2 (red), LYVE1 (green), and DAPI (blue) reveal lymphatic structures co-localized with MetAp2 expression. Black and white images represent fluorescence in a single channel. Left panel scale bar = 100 µm. Right panel scale bar = 20–50 µm.

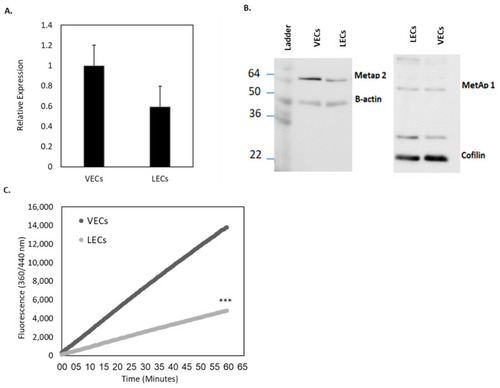
Basal MetAp2 activity and expression in LECs compared with VECs. (A) The MetAp2 mRNA levels in LECs (HMVEC-dLyAd cells) is ~60% of the mRNA levels in VECs (HUVECs), as measured by qRT-PCR (5 μg), n = 3. (B) Western blot analyses for determining the expression of MetAp2 in both cell lines. (C) Measurement of the basal activity of MetAp2 in HUVECs and HMVEC-dLyAd cells. A homogenate containing an equal number of cells was added to an L-Met-AMC solution (250 µM). The reaction was monitored for 1 h via the fluorescent quantification of the cleaved substrate. MetAp2 in HMVEC-dLyAd cells showed over a 65% reduction in the enzymatic ability to cleave labeled methionine when compared with HUVECs. The results were normalized to the total cell number. *** p < 0.001. The results are presented as mean ± SEM.

MetAp2 inhibition affects the activity and expression of MetAp2 in LECs. (A) The addition of 10 μM TNP-470 treatment inhibits the enzymatic activity of MetAp2 by 23% over the course of 2 h, n = 2. (B) HMVEC-dLyAd cells were treated with 0, 0.1, 1 and 5 μM of TNP-470, and the MetAp2 mRNA levels were measured after 4 h of incubation using qRT-PCR. The inhibition of MetAp2 reduced the MetAp2 mRNA expression levels to 64%, 70% and 80%, respectively. n = 3. *** p < 0.001.

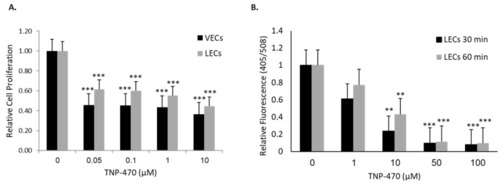
Inhibition of VEC and LEC proliferation and adhesion induced by the inhibition of MetAp2. (A) MetAp2 inhibition impairs the ability of both cell lines to proliferate. Cells were treated with different concentrations of TNP-470 for 72 h, after which an MTT assay was conducted to quantify their proliferation. A dose-dependent reduction was observed. *** p < 0.005, compared with the control of the same cells. n = 5. (B) HMVEC-dLyAd cells were stained with DiO and treated with TNP-470; they showed a significant decrease in their ability to adhere. The relative fluorescent cell population was quantified using the Synergy HT multi-mode microplate reader. n = 4. ** p <0.01, *** p < 0.001. The results are presented as mean ± SEM.

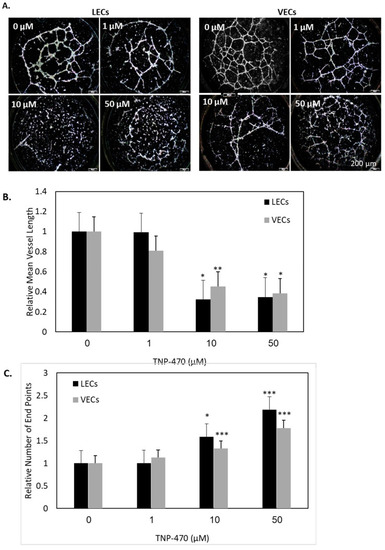
MetAp2 inhibition blocked tube formation in VECs and LECs. (A) MetAp2 inhibition impaired HUVECs’ and HMVEC-dLyAd cells’ ability to form tubes. HUVECs and HMVEC-dLyAd cells were seeded on Matrigel and incubated for 14 h under different concentration treatments of TNP-470 (0–50 µM). When no TNP-470 was present, extensive neovascularization was clearly visible and an organized capillary network was formed. When the dose of TNP-470 was elevated to 1–50 μm, the cells’ ability to migrate and reorganize into tubes was impaired. n = 8. (B,C) Metap2 inhibition resulting from exposure to TNP-470 caused a reduction in the relative vessel length and an increase in the relative number of end points in both cell lines, as quantified using the AngioTool image analysis software. n = 8. * p < 0.05, *** p < 0.001. The results are presented as mean ± SEM. Scale bar = 200 μm.

Reduction in the lymphatic vasculature in TNP-470-treated zebrafish embryos carrying the fli1:EGFPy1 transgene. (A) Zebrafish treated with 500 μM of TNP-470 showed a reduced lymphatic vasculature (right) when compared with untreated zebrafish (left). Images were acquired using a Zeiss LSM700 confocal microscope and an Axio Imager M2 compound microscope. (B) Statistical analysis of the presence of lymphatic vessels of the treated and untreated groups. DA, dorsal aorta; PCV, posterior cardinal vein. Asterisks mark ISVs, and arrows point at PACs. n = 17. ** p < 0.01. The results are presented as mean ± SEM. Scale bar = 50 μm.

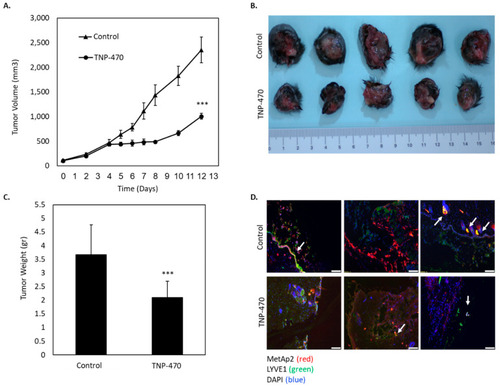
MetAp2 inhibition suppresses the growth of murine melanoma tumors. C57/BL6J mice were injected S.C. with B16/F10 cells, overexpressing VEGF-C (1.5 × 10⁶ cells/tumor). The mice were divided into two groups, untreated and treated with TNP-470 (30 mg/kg q.o.d). n = 8–10. (A) The tumor volume after 12 days of treatment with TNP-470 was significantly lower (2.3-fold) when compared with the untreated group. *** p < 0.005. (B) Representative images of tumors extracted from the untreated and treated groups after 12 days of TNP-470 treatment. (C) The mean weight of the tumors extracted from the untreated and treated mice following 12 days of TNP-470 treatment. n = 8. *** p < 0.005. (D) Immunofluorescent staining for MetAp2 (red), LYVE1 (green) and DAPI (blue) shows lymphatic structures (white arrows). The results are presented as mean ± SEM. Scale bar = 100 μm.

Acknowledgments
This image is the copyrighted work of the attributed author or publisher, and ZFIN has permission only to display this image to its users. Additional permissions should be obtained from the applicable author or publisher of the image. Full text @ Int. J. Mol. Sci.