FIGURE SUMMARY
Title

Bi-FoRe: an efficient bidirectional knockin strategy to generate pairwise conditional alleles with fluorescent indicators

Authors
Han, B., Zhang, Y., Bi, X., Zhou, Y., Krueger, C.J., Hu, X., Zhu, Z., Tong, X., Zhang, B.
Source
Full text @ Protein Cell

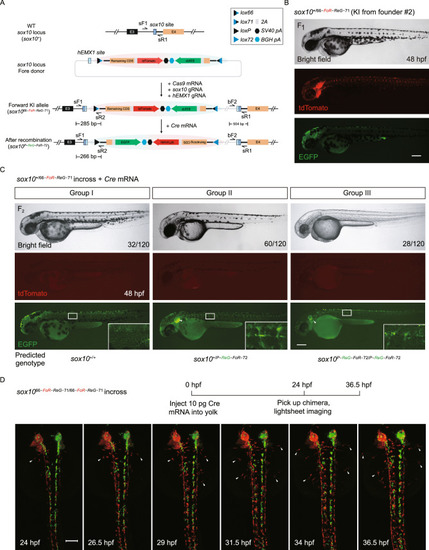
Generation and evaluation of fluorescent reporter-tagged conditional knockout alleles at the zebrafish sox10 locus and mosaic tracing analysis of sox10 expressing cells. (A) Schematic diagram of the KI strategy of sox10 FoRe donor consisting of two components in opposite orientations (highlighted by red shadow for the Forward component for maintaining the function of sox10, and green shadow for the Reverse component for disrupting the function of sox10). The sox10 CRISPR/Cas target site is shown as a dark blue box, and the hEMX1 target site is shown as a light blue box. (B) Images of a 48 hpf F1 embryo from germline transmission screening of the sox10 FoRe donor KI founder. Scale bar, 200 μm. (C) Phenotype analysis of the 48 hpf F2 embryos from the incross of sox10+/66-PoR-ReG−71 heterozygotes (derived from F0 #2) after the injection of 50 pg Cre mRNA at the one-cell stage. The white arrowheads indicate otic vesicles. Detailed sox10 expression in the trunk region can be seen under higher magnification of the boxed areas. Scale bar, 200 μm. (D) Serial lightsheet images of a sox10 mosaic embryo from incross of sox1066-FoR-ReG−71/66-FoR-ReG−71 homozygotes after vegetal pole injection of 10 pg Cre mRNA and recorded from 24 hpf to 36.5 hpf. Some of the tdTomato-positive neural crest cells could migrate to the two sides of the body (as indicated by the white arrowheads), while all of the EGFP-positive cells remained in the middle. Scale bar, 100 μm

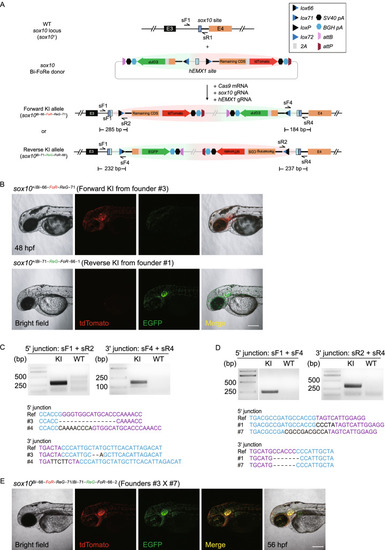
Generation of positive and negative conditional allele pairs at the sox10 locus through the Bi-FoRe strategy. (A) Schematic diagram of the improved KI strategy based on the bidirectional multi-purpose Bi-FoRe donor consisting of two functional components. The Forward component (highlighted by red shadow) is designed to maintain the function of the sox10 gene, and the Reverse component (highlighted by green shadow) is designed to disrupt the sox10 function. The sox10 CRISPR/Cas target site is shown in dark blue, and the hEMX1 target site is shown in light blue, located in the middle of the two functional components in the donor, to facilitate unbiased identification of both forward and reverse integrations of the donor. (B) Z-stack confocal images of a 48 hpf sox10+/Bi−66-FoR-ReG−71 F1 embryo from outcross of founder #3 and a 48 hpf sox10+/Bi−71-ReG-FoR−66−1 F1 embryo from outcross of founder #1, respectively. Scale bar, 200 μm. (C) Junction PCR and direct sequencing results of F1 progeny showing tdTomato expression from outcross of F0 #3 or #4, demonstrating forward insertion of the sox10 Bi-FoRe donor. KI: pooled genomic DNA template of F1 embryos from outcross of F0 #3. WT: pooled genomic DNA template of wild-type embryos. (D) Junction PCR and direct sequencing results of F1 progeny showing EGFP expression from outcross of F0 #1 or #7, demonstrating reverse insertion of the sox10 Bi-FoRe donor. KI: pooled genomic DNA template of the F1 embryos from outcross of F0 #1. WT: pooled genomic DNA template of wild-type embryos. (E) Z-stack confocal images of a 56 hpf sox10Bi−66-FoR-ReG−71/Bi−71-ReG-FoR−66−2 F1 embryo from the cross between founders #3 and #7, showing overlapping expression of tdTomato and EGFP. Scale bar, 200 μm

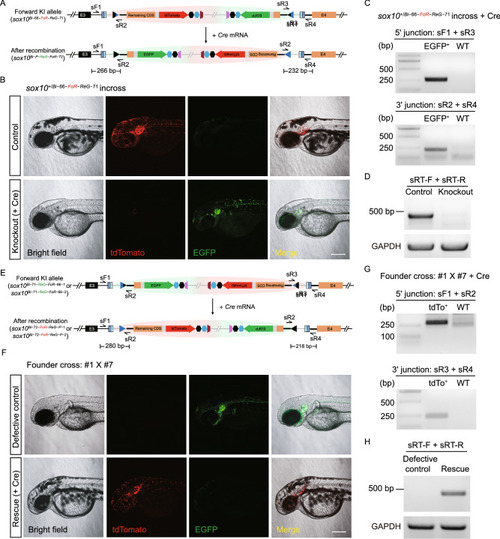
Evaluation of conditional manipulation of paired positive and negative conditional Bi-FoRe KI alleles at the sox10 locus. (A) Schematic diagram of the positive conditional allele (Forward KI allele) sox10Bi−66-FoR-ReG−71 before and after Cre-mediated recombination. (B) Z-stack confocal images of F2 embryos obtained from incross of F1sox10+/Bi−66-FoR-ReG−71 heterozygotes. Upper panel: An embryo without Cre mRNA injection, showing tdTomato expression and normal pigmentation. Lower panel: An embryo after Cre mRNA injection, showing EGFP expression and defects in pigmentation, resembling sox10 mutant phenotype. Scale bar, 200 μm. (C) Junction PCR results of the F2 embryos from incross of sox10+/Bi−66-FoR-ReG−71 after Cre mRNA injection. EGFP+: pooled genomic DNA template of the F2 progeny showing EGFP expression after Cre mRNA injection. WT: pooled genomic DNA template of wild-type embryos. (D) RT-PCR results using the cDNA of the F2 embryos from B with (Knockout) or without (Control) Cre mRNA injection. (E) Schematic diagram of the negative conditional alleles (Reverse KI allele) sox10Bi−71-ReG-FoR−66−1 and sox10Bi−71-ReG-FoR−2 before and after Cre-mediated recombination. (F) Z-stack confocal images of the embryos obtained from a cross of F0 #1 bearing the sox10Bi−71-ReG-FoR−66−1 allele with #7 bearing the sox10Bi−71-ReG-FoR−66−2 allele. Upper panel: F1 embryo without Cre mRNA injection, showing EGFP expression as well as defects in pigmentation, resembling sox10 mutant phenotype. Lower panel: F1 embryo with Cre mRNA injection, showing tdTomato expression and recovery of pigmentation. Scale bar, 200 μm. (G) Junction PCR results of the F1 embryos from the cross of F0 #1 with #7 after Cre mRNA injection. tdTo+: pooled genomic DNA template from the F1 progeny showing tdTomato expression after Cre mRNA injection. WT: pooled genomic DNA template of wild-type embryos. (H) RT-PCR results using the cDNA of the embryos from panel F with (Rescue) or without (Defective control) Cre mRNA injection. The location of RT-PCR primers in D and H is indicated in Fig. S3C. The expected size of the band is 467 bp

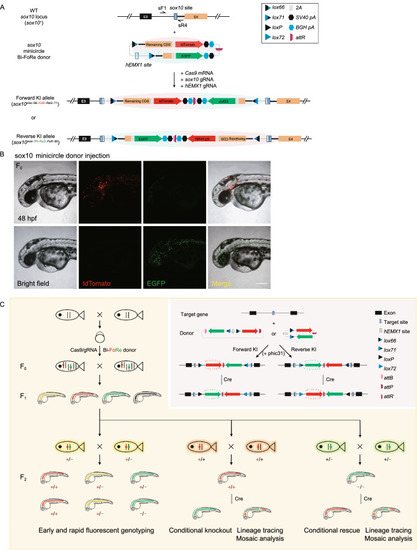
Generation of conditional sox10 KI alleles using minicircle donor and summary of our bidirectional KI strategy. (A) Schematic diagram of the KI strategy based on the minicircle Bi-FoRe donor derived from in vitro backbone elimination. (B) Representative z-stack confocal images of two 48 hpf founder embryos after injection of the sox10 minicircle Bi-FoRe donor vector together with the CRISPR/Cas9 system, showing red (representing forward insertion) and green (representing reverse insertion) fluorescent signals, respectively. Scale bar, 200 μm. (C) A graphical summary of the principle and applications of our Bi-FoRe KI strategy

Acknowledgments
This image is the copyrighted work of the attributed author or publisher, and ZFIN has permission only to display this image to its users. Additional permissions should be obtained from the applicable author or publisher of the image. Full text @ Protein Cell