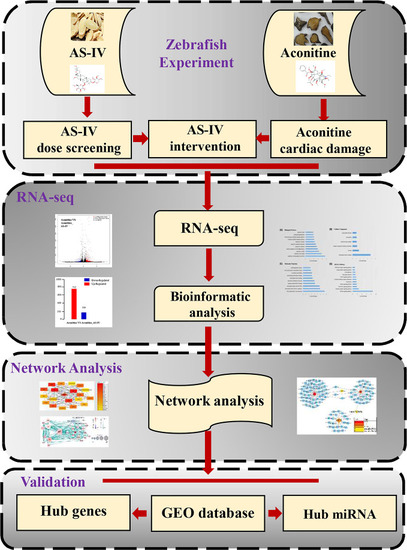
Workflow for AS-IV intervention in aconitine-induced cardiac damage in zebrafish.
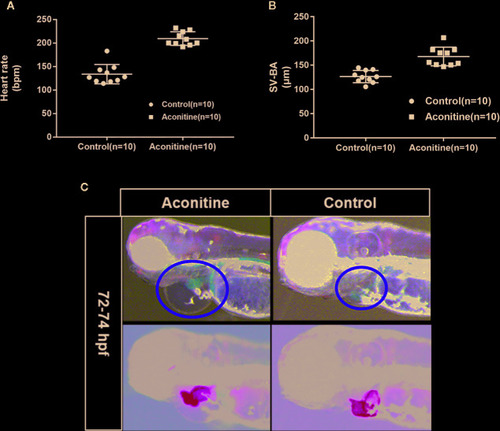
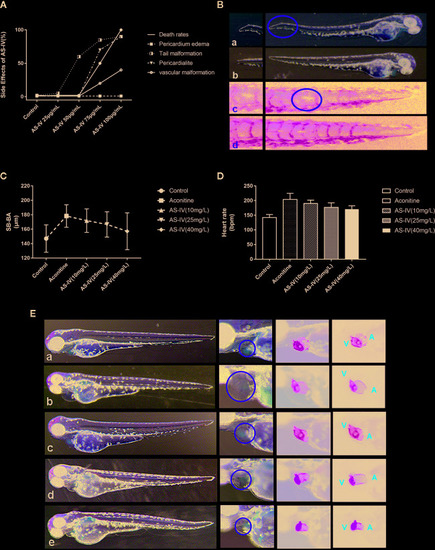
(A) Heart rates of zebrafish in aconitine group at 72 hpf (n = 10). (B) SV-BA distance, comparing control group with aconitine group (n = 10). (C) Effect of aconitine on the morphology of zebrafish heart.

(A) Effects of different doses of AS-IV on mortality, and development of the heart and other parts of the zebrafish. (B) At 50 mg/L AS-IV, abnormal tail vascular development and tail malformation starts to become apparent. (C) Comparison of heart rates of zebrafish in each group (histogram). (D) Comparison of distance SV-BA in each group (trend graph). (E) Changes in heart morphology of zebrafish in each group. (a) Control group, (b) Aconitine group, (c) AS-IV 10 mg/L group, (d) AS-IV 25 mg/L group, (e) AS-IV 40 mg/L group.

(A) Statistical chart of the number of DEGs. The horizontal axis represents comparison of different samples, the vertical axis represents the number of DEGs, red represents up-regulation, blue represents down-regulation. (B) Volcano Plot of DEGs. Each dot in the volcano plot of DEGs represents a gene. The red dots in the plot represent up-regulated DEGs, the blue dots represent down-regulated DEGs, and the black dots represent non-differentially expressed genes. The dotted line means the threshold lines of FDR and fold change (C) Biological Process diagram of DEGs. X axis represents -log10 (p-value). Y axis represents enrichment names. (D) Cellular component diagram of DEGs. (E) Molecular function diagram of DEGs. (F) Diagram of KEGG pathway.

(A) Hub genes identified by Cytoscape network analysis. The shade of the color indicates the degree of the gene. The list on the right is the result of the top 20 genes. (B) Protein-protein interaction data network of ATF3. Red, up-regulation; blue, down-regulation. Color depth and size of the dots were proportional to the fold change and correlated degree, respectively; thickness of the line between the two nodes indicated the connection strength positively. (C) DNA-microRNA network of ATF3. The shade of the color indicates the degree of the genes. The list on the right is the result of the top 5 genes.

Acknowledgments
This image is the copyrighted work of the attributed author or publisher, and ZFIN has permission only to display this image to its users. Additional permissions should be obtained from the applicable author or publisher of the image. Full text @ Front Pharmacol