
Figure 4
- ID
- ZDB-IMAGE-200718-7
- Publication
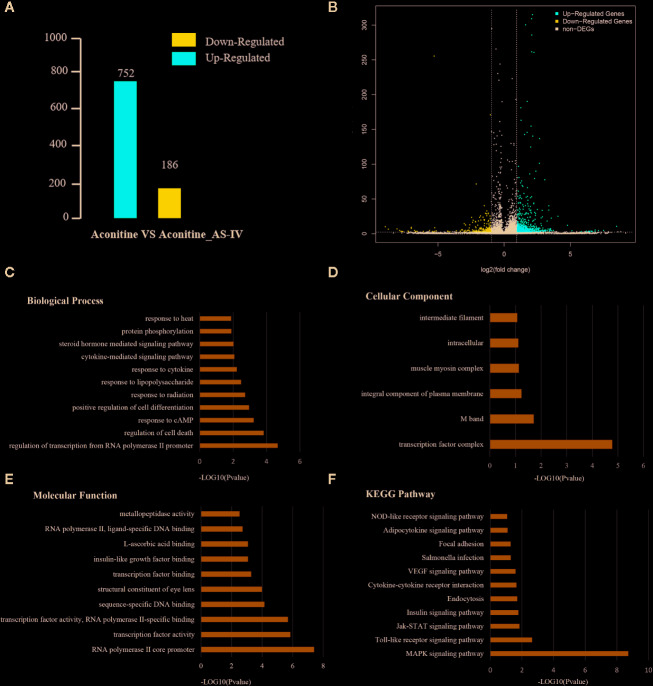
- Wang et al., 2020 - Identification of Hub Genes in Protective Effect of Astragaloside IV on Aconitine-Induced Cardiac Damage in Zebrafish Based on Bioinformatics Analysis
- All Figures
- Figures for Wang et al., 2020
|
Figure 4