Predicted protein sequence of <italic>psen2</italic><sup><italic>S4Ter</italic></sup>.

(A) An 8-bp deletion resulted in a frameshift downstream of the nominal translation start codon of psen2 creating a stop codon as the 4th codon. (B) Comparison of the epidermal pigmentation of adult, male zebrafish. Wild type (upper), psen2S4Ter homozygous (middle), and psen2N140fs homozygous (lower) zebrafish. The S4Ter mutation permits apparently normal melanotic epidermal pigmentation while the N140fs mutation does not.

Allele-specific mRNA expression in the brains of 6-month-old fish of different genotypes under normoxia or acute hypoxia (as copies per 25 ng of brain cDNA in each dqPCR).

(A) The levels of wild type psen2 allele mRNA in the psen2S4Ter/+ fish (~700 copies) were significantly (p = 0.0039) lower than in their wild type siblings (~1,300 copies) under normoxia. Under hypoxia, the levels of wild type psen2 allele mRNA in both the psen2S4Ter/+ fish (~1,000 copies) and their wild type siblings (~1,800 copies) were apparently up-regulated, but only the higher levels in the wild type fish showed a statistically significant increase (p = 0.0117) compared to the normoxic controls. (B) The levels of psen2S4Ter allele mRNA in the psen2S4Ter/+ fish (~700 copies) appeared to be lower than in the psen2S4Ter/psen2S4Ter fish (~1,000 copies) under normoxia. However, this comparison did not reach statistical significance (p = 0.0777). Under hypoxia, the levels of psen2S4Ter allele mRNA in both the psen2S4Ter/+ fish (~1,000 copies) and the psen2S4Ter/psen2S4Ter fish (~1,900 copies) were upregulated. This up-regulation in the psen2S4Ter/psen2S4Ter fish was clearly significant (p = 0.0002), while that in the psen2S4Ter/+ fish was apparent, but not regarded as statistically significant (p = 0.1185). Data is shown as the mean ± SD. Values of p were determined by a two-way ANOVA followed by Tukey’s HSD test. The dqPCR raw data is given in S1 & S2 Tables in S1 File.

EXPRESSION / LABELING:
Gene:
Fish:
Condition:
Anatomical Term:
Stage: Adult
PHENOTYPE:
Fish:
Condition:
Observed In:
Stage: Adult

DoLA neuron number assessment of <italic>psen2</italic> activity.

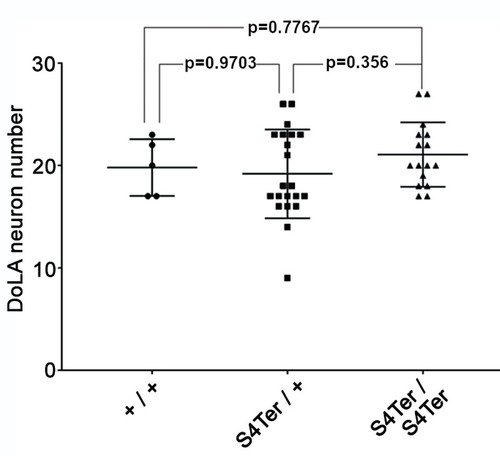
42 embryos at 24 hpf from a pair-mating of a psen2S4Ter/+ female and a psen2S4Ter/+ male were subjected to in situ hybridization to detect DoLA neurons that were then counted. Subsequent genotyping of individual embryos revealed 21 heterozygous mutants, 16 homozygous mutants and 5 wild type embryos. Data is shown as the mean ± SD. Values of p were determined by a one-way ANOVA followed by Dunnett’s T3 multiple comparisons test. Raw data is given in S3 Table in S1 File.

Testing for translation initiation at novel downstream start codons.

(A) The constructs, psen2WT-EGFP (upper) and psen2S4Ter-EGFP (lower) used to test for translation initiation at Met codons downstream of the S4Ter mutation. S1 represents the wild type translation start site and S2-4 are potential downstream translation initiation sites within the first 113 codons. (B) Western immunoblotting of lysates from embryos injected with the constructs described in A. Translation initiation at S1 (S1-EGFP) does not permit initiation at S2-4. However, in the presence of the S4Ter mutation, initiation is evident at S2 (S2-EGFP) and either S3 or S4 or both (S3/4-EGFP). The identity of the low intensity ~35kDa protein band is not known but it may be a degradation product of larger fusion protein species. Free EGFP can be produced from EGFP fusion protein species in the lysosome [53, 54]. (C) A representation of the fusion proteins predicted to be produced after injection into embryos of psen2S4Ter-EGFP mRNA and translation initiation at S2, S3, or S4. Note that their representation here as inserting into a lipid bilayer cannot be assumed. Green arrows indicate the positions of downstream alternative possible in-frame start codons (Met codons) in the zebrafish Psen2-coding sequence (represented as a protein sequence). Black arrows indicate the approximate positions of out-of-frame possible alternative start codons. No proteins produced by translation from such out-of-frame start codons would be detectable with the anti-GFP antibody used in B. The S4 residue affected by the S4Ter mutation is shown in red. The “acidic cluster” of residues at the N-terminal of zebrafish Psen2 as defined in Fig 3A of Sannerud et al. [52] is indicated by the blue background and the residues shaded grey in the protein alignment in that figure are indicated here by orange halos. The zebrafish fusion proteins are shown alongside a representation of human PSEN2 protein modified from the interactive diagram at Alzforum.org (version 2.4–2019, used with permission of FBRI LLC). Amino acid residues altered by known coding variants are color-coded as pathogenic (dark orange), non-pathogenic (green) or of uncertain pathogenicity (blue). Residue numbers, numbered transmembrane domains (TM), and the boundaries of numbered exons (Ex) containing the coding sequence are shown.

Brain transcriptome analysis.

(A) Pair-mating of two Het zebrafish produces a family made up of WT, Het, and Hom siblings in a ~1:2:1 ratio respectively. At six months of age, the transcriptomes of entire brains from four female sibling fish each of WT, Het, and Hom genotypes were analyzed. (B) PCA showing PC1 and PC2 using logCPM values from each sample. The largest source of variability within this data set was clearly the difference between wild type samples and those containing one or two copies of the psen2S4Ter allele. (C) Volcano plots displaying gene differential expression (DE) p-values versus fold-change. Left: DE genes from comparison of Het and Hom brains. Right: DE genes from comparison of brains of fish possessing the S4Ter allele (i.e. either Het or Hom) versus WT. The dominant nature of the S4Ter mutation is indicated by the relatively restricted differences between Het and Hom transcriptomes compared to S4Ter vs. WT.

Heatmaps of DE genes.

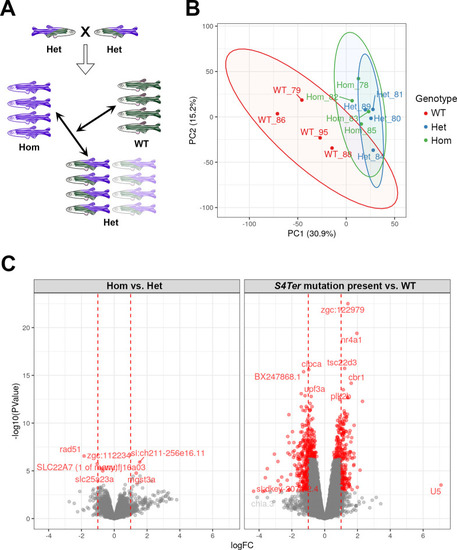
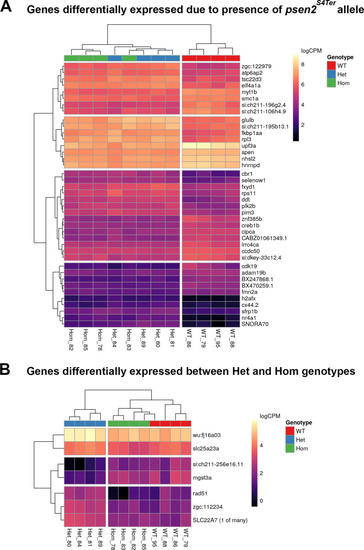
Plotted values are logCPM based on CQN-normalized counts. (A) The most highly ranked 40 (of the 615) DE genes by FDR identified when comparing WT fish to genotypes possessing the psen2S4Ter allele. (B) The 7 most highly-ranked genes (FDR < 0.05) which were detected as DE between Het and Hom mutant genotypes. Unique sample name identifiers are given beneath each column.

UpSet plot indicating distribution of DE genes within larger significant terms from the GO gene sets.

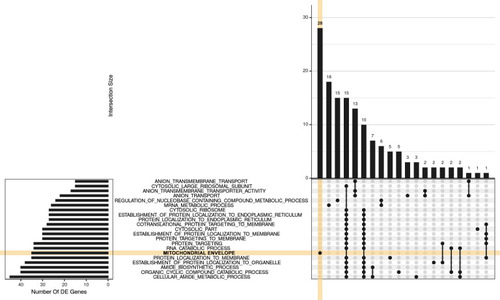
For this visualization, GO terms were restricted to those with 15 or more DE genes, where this represented more than 5% of the gene set, along with an FDR < 0.02 and more than 3 steps back to the ontology root. The 20 largest GO terms satisfying these criteria are shown with the plot being truncated at the right hand side for simplicity. A group of 28 genes is uniquely attributed to the GO MITOCHONDRIAL ENVELOPE (orange shading), with a further 18 being relatively unique to the GO MRNA METABOLIC PROCESS. The next grouping of 15 genes is unique to GO REGULATION OF NUCLEOBASE-CONTAINING COMPOUND METABOLIC PROCESS followed by 25 genes, spread across two clusters of terms which largely represent GO RIBOSOMAL ACTIVITY. In between these are 13 genes uniquely associated with the GO ANION TRANSPORT.

Acknowledgments
This image is the copyrighted work of the attributed author or publisher, and ZFIN has permission only to display this image to its users. Additional permissions should be obtained from the applicable author or publisher of the image. Full text @ PLoS One