
- Title
-
Ameliorative Effects of Rhoifolin in Scopolamine-Induced Amnesic Zebrafish (Danio rerio) Model
- Authors
- Brinza, I., Abd-Alkhalek, A.M., El-Raey, M.A., Boiangiu, R.S., Eldahshan, O.A., Hritcu, L.
- Source
- Full text @ Antioxidants (Basel)

Chemical structure of rhoifolin (apigenin 7-O-β neohesperidoside). |
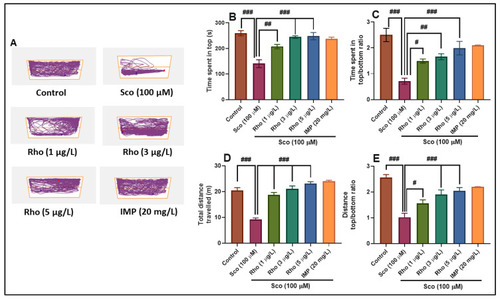
Rhoifolin (Rho: 1, 3, and 5 μg/L) improved the locomotion pattern and reduced anxiety in the novel tank diving test (NTT). ( PHENOTYPE:
|
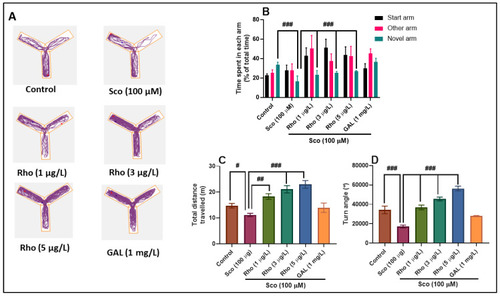
Rhoifolin (Rho: 1, 3, and 5 μg/L) improved the locomotion pattern and memory in the Y-maze test. ( PHENOTYPE:
|

Rhoifolin (Rho: 1, 3, and 5 μg/L) improved memory in the novel object recognition test (NOR). ( |

Rhoifolin (Rho: 1, 3, and 5 μg/L) exhibited an anti-AChE effect and improved the antioxidant status in the zebrafish brain. ( PHENOTYPE:
|