IMAGE

Figure 2

ID
ZDB-IMAGE-200811-32
Source
Figures for Brinza et al., 2020
Image
Figure Caption

Figure 2

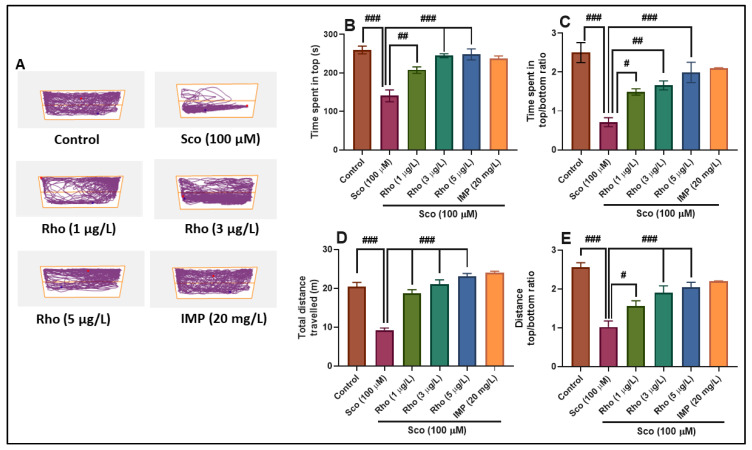
Rhoifolin (Rho: 1, 3, and 5 μg/L) improved the locomotion pattern and reduced anxiety in the novel tank diving test (NTT). (A) Representative locomotion tracking pattern of the control, scopolamine (Sco: 100 μM), rhoifolin (Rho: 1, 3, and 5 µg/L), and imipramine (IMP: 20 mg/L) treated groups. (B) Representation of the time spent in the top zone by zebrafish in the tank in different groups. (C) Representation of the time spent in top/bottom ratio in different groups. (D) Representation of the total distance traveled by zebrafish in the tank in different groups. (E) Representation of the distance top/bottom ratio in different groups. The values are means ± S.E.M. (n = 10). For Tukey’s post hoc analyses: (B) Control vs. Sco (100 μM): ### p < 0.0001, Sco (100 μM) vs. Rho (1 μg/L): ## p < 0.001, Sco (100 μM) vs. Rho (3 μg/L): ### p < 0.0001 and Sco (100 μM) vs. Rho (5 μg/L): ### p < 0.0001; (C) Control vs. Sco (100 μM): ### p < 0.0001, Sco (100 μM) vs. Rho (1 μg/L): # p < 0.01, Sco (100 μM) vs. Rho (3 μg/L): ## p < 0.001, and Sco (100 μM) vs. Rho (5 μg/L): ### p < 0.0001; (D) Control vs. Sco (100 μM): ### p < 0.0001, Sco (100 μM) vs. Rho (1 μg/L): ### p < 0.0001, Sco (100 μM) vs. Rho (3 μg/L): ### p < 0.0001, and Sco (100 μM) vs. Rho (5 μg/L): ### p < 0.0001; (E) Control vs. Sco (100 μM): ### p < 0.0001, Sco (100 μM) vs. Rho (1 μg/L): # p < 0.01, Sco (100 μM) vs. Rho (3 μg/L): ### p < 0.0001, and Sco (100 μM) vs. Rho (5 μg/L): ### p < 0.0001.

Figure Data
Acknowledgments
This image is the copyrighted work of the attributed author or publisher, and ZFIN has permission only to display this image to its users. Additional permissions should be obtained from the applicable author or publisher of the image. Full text @ Antioxidants (Basel)