
- Title
-
Cell stemness is maintained upon concurrent expression of RB and the mitochondrial ribosomal protein S18-2
- Authors
- Mushtaq, M., Kovalevska, L., Darekar, S., Abramsson, A., Zetterberg, H., Kashuba, V., Klein, G., Arsenian-Henriksson, M., Kashuba, E.
- Source
- Full text @ Proc. Natl. Acad. Sci. USA
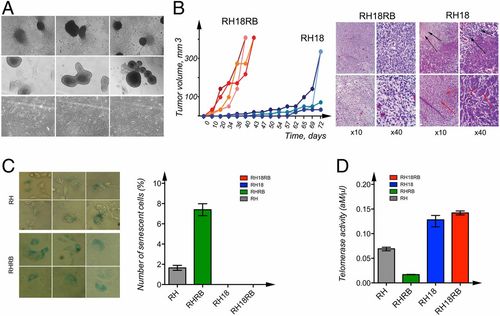
Characterization of cell lines generated from Rb1−/− MEFs. (A) Phase-contrast images of RH18RB cells in cell culture dishes (Upper) and in bacterial petri dishes (Middle). Phase-contrast images of RH18 cells in cell culture dishes (Lower). (B) The kinetics of tumor growth of RH18 and RH18RB cells as indicated in SCID mice (Left). Sections of the tumors produced by RH18 and RH18RB cells were stained with hematoxylin and eosin. The RH18RB cells generated aggressive fibrosarcomas. The RH18 tumors contained large necrotic areas (Right, black arrows). A proportion of the cells in these tumors resembled epithelium-like cells (Right, red arrows). (C) Staining with β-galactosidase for the identification of senescent RHRB (Top Left) and RH (Bottom Left) cultures. Arrows indicate cells producing β-galactosidase. The number of senescent cells was analyzed using column analysis and an unpaired t test (Right). (D) The telomerase activity in RH, RHRB, RH18, and RH18RB cells was determined via the QTD method using qPCR. Each bar represents the mean telomerase activity of each cell culture. Reactions were performed twice, with each cell line assessed in triplicate. Statistical analysis was performed as in C. |
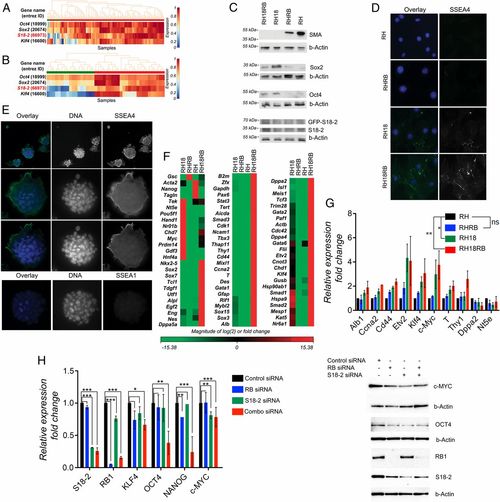
Induction of stem cell markers in Rb1−/− MEF sublines expressing RB and S18-2. (A) Analysis of S18-2 mRNA expression in mouse ESCs and in differentiated cells using the StemMapper database. Red: mouse ESCs; green: differentiated mouse cells. (B) Analysis of S18-2 mRNA expression in iPSCs and differentiated iPSCs using the StemMapper database. Red: iPSCs; green: differentiated iPSCs. (C) Western blotting of cell extracts using the indicated antibodies. Beta-Actin (b-Actin) was used as a loading control. (D) Immunostaining with anti-SSEA4 antibody. DNA is stained blue. (E) RH18RB cells were grown in bacterial petri dishes and cultured overnight on glass slides, followed by staining with antibodies against SSEA1 and SSEA4. DNA is stained in blue. (F) Heat map of data obtained from an expression array of 84 genes associated with mouse ESCs: red indicates genes that were expressed at higher levels and green indicates genes that were expressed at lower levels in RH18, RHRB, and RH18RB cells compared with RH cells. (G) The expression of the indicated set of genes was assessed by qPCR using TBP, beta-actin, or gapdh as endogenous controls and is presented as fold change compared to the internal controls. (H) Expression pattern of stemness-related genes or proteins in human mesenchymal stem cells after siRNA treatment. (Left) qPCR of the indicated genes presented as fold change compared to GAPDH which served as the internal control. *0.03 < P < 0.05; **0.01 < P < 0.03; ***P < 0.01. (Right) Western blot analysis using the antibodies for proteins encoded by the genes analyzed in the qPCR as indicated. b-Actin was used as a loading control. |

Multilineage differentiation of RH18 and RH18RB cells induced in vitro. (A) Alizarin Red S was used to qualitatively assess the presence of cells producing Ca2+ ions to monitor osteogenic lineage differentiation in the indicated cell lines. (B) mRNA expression of Runx2 (Left) and Spp1 (Right) was assessed by qPCR. The qPCRs were performed in triplicate, and data with SE mean values are shown. (C) Representation of control cells and cells differentiated into the chondrogenic lineage in RH18RB cells at 2 and 4 wk, respectively. (D) Expression of the Sox9 gene was assessed at the mRNA and protein levels by qPCR (Left) and Western blotting (Right), respectively. The qPCR conditions were as indicated in B. b-Actin was used as a loading control for Western blot. (E) Qualitative reaction with Oil Red O stain to monitor lipid droplets in cells differentiated into the adipogenic lineage in the indicated cell lines. (F) Lipid production was quantified using a colorimetric analysis in the indicated cell lines. The Kruskal–Wallis test was performed for four groups with three values for each group. |
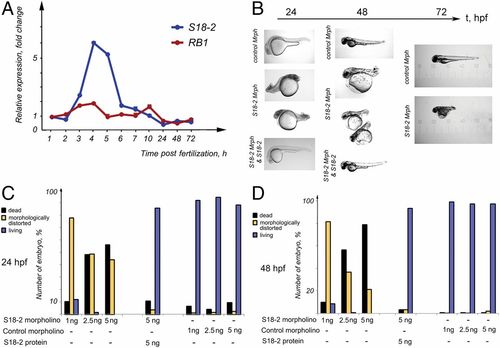
A vital role for S18-2 during zebrafish embryogenesis. (A) The mRNA expression levels of RB1 (blue line) and S18-2 (red line) were assessed at different stages of zebrafish development using qPCR. The mean values of three qPCR experiments are shown. The SD was not more than 20% of the mean. β-Actin was used as a housekeeping gene, and the expression levels detected in eggs at 0 hpf were taken as the reference expression level. (B) A specific morpholino that inhibited S18-2 translation, a control morpholino, or a S18-2–specific morpholino, together with in vitro-translated S18-2 protein, were introduced into fish eggs within 1 hpf. The morphology of the larvae was observed over 1 to 72 hpf using bright-field microscopy. (C) Quantification of embryos showing morphological changes at 24 h (see details in SI Appendix, Table S3) after the indicated treatments. (D) Quantification of embryos showing morphological changes at 48 h after the indicated treatments. Each bar in C and D represents the mean of four to five measurements; the deviation was less than 30%. EXPRESSION / LABELING:
PHENOTYPE:
|