
|
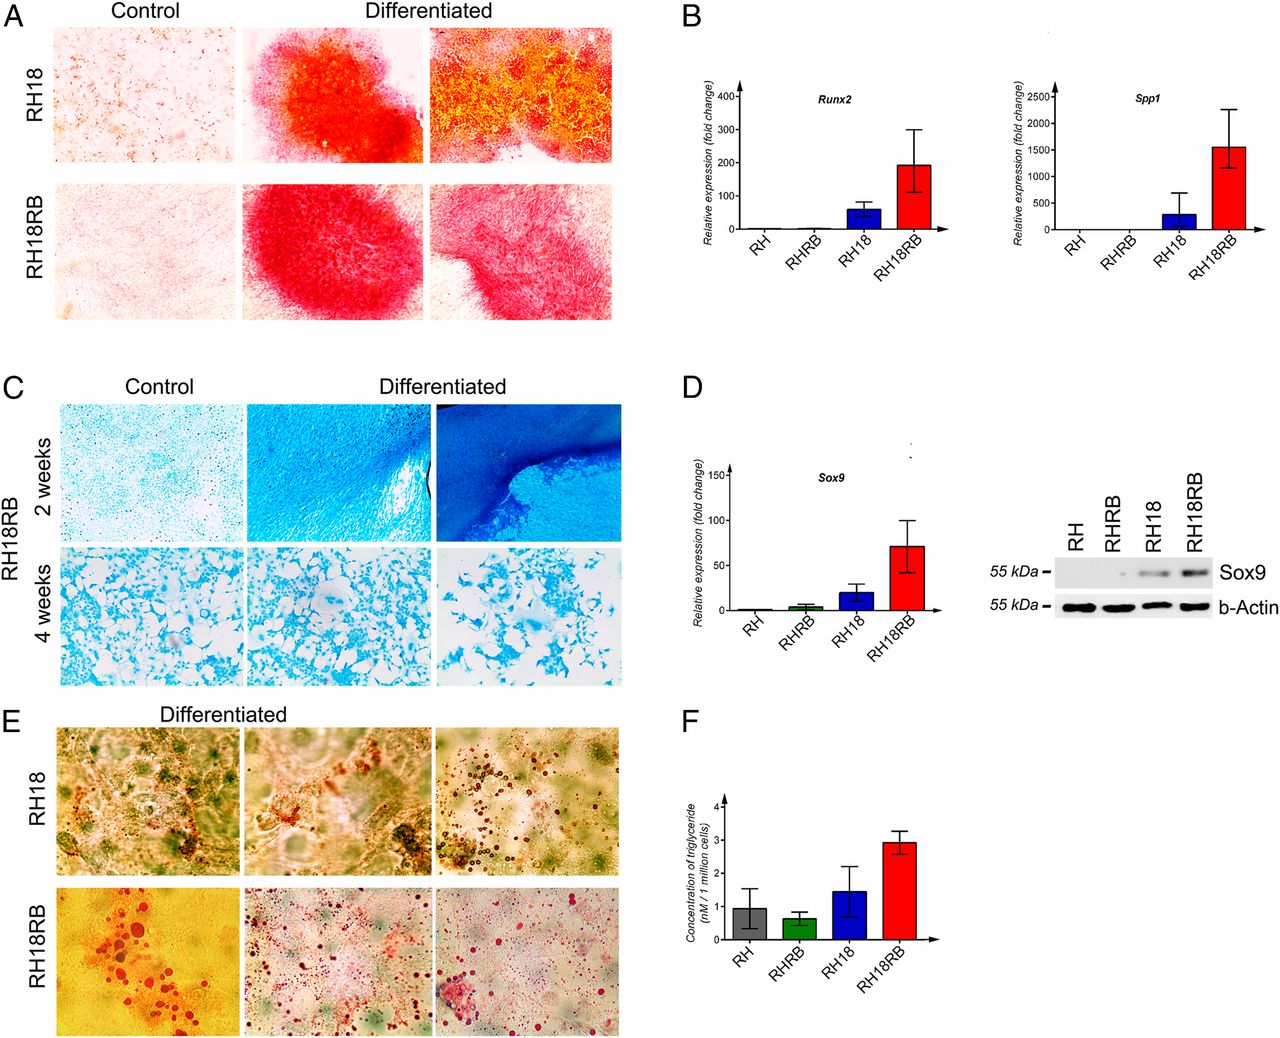
Fig. 3 Multilineage differentiation of RH18 and RH18RB cells induced in vitro. (A) Alizarin Red S was used to qualitatively assess the presence of cells producing Ca2+ ions to monitor osteogenic lineage differentiation in the indicated cell lines. (B) mRNA expression of Runx2 (Left) and Spp1 (Right) was assessed by qPCR. The qPCRs were performed in triplicate, and data with SE mean values are shown. (C) Representation of control cells and cells differentiated into the chondrogenic lineage in RH18RB cells at 2 and 4 wk, respectively. (D) Expression of the Sox9 gene was assessed at the mRNA and protein levels by qPCR (Left) and Western blotting (Right), respectively. The qPCR conditions were as indicated in B. b-Actin was used as a loading control for Western blot. (E) Qualitative reaction with Oil Red O stain to monitor lipid droplets in cells differentiated into the adipogenic lineage in the indicated cell lines. (F) Lipid production was quantified using a colorimetric analysis in the indicated cell lines. The Kruskal–Wallis test was performed for four groups with three values for each group.