
- Title
-
Liquiritigenin reduces osteoclast activity in zebrafish model of glucocorticoid-induced osteoporosis
- Authors
- Carnovali, M., Banfi, G., Mariotti, M.
- Source
- Full text @ J. Pharmacol. Sci.

Mineralization rate in zebrafish embryos treated with different LTG concentrations for 6 days. (A) 10 nM LTG treatment induces an increase of 71% of the mineralization rate respect the untreated embryos (CTR vs. 10 nM LTG, p < 0,05). The mineralization rate was evaluated as ratio of the number of mineralized vertebral bodies along body length (NV/L). (B) Alcian blue/ARS acid-free staining highlights an increased number of vertebral bodies (black arrows) in 10 nM LTG embryos vs untreated controls (CTR). No toxicity has been detected. . (For interpretation of the references to color in this figure legend, the reader is referred to the Web version of this article.) PHENOTYPE:
|

Calcein vital staining of scales from adult zebrafish treated with LTG ± PN evaluated for the presence of resorption lacunae (white arrow) along the scale border. The percentage indicates the fraction of the scales with that feature. PN-treated fish show resorption lacunae in all the scales while LTG+PN treated fish show an intact mineralized matrix in 90% of scales. PHENOTYPE:
|

Analysis of TRAP activity in LTG-treated GIOP fish. (A) Percentage of TRAP-positive scales in adult zebrafish treated with different LTG concentrations with (PN vs 10pM LTG, p < 0.001; PN vs 100pM LTG, p < 0.001; PN vs 1 nM LTG) or without PN (CTR vs 10pM LTG, p < 0.001; CTR vs 100pM LTG, p < 0.001; CTR vs 1 nM LTG, p < 0.001; CTR vs 10 nM LTG, p < 0.001; CTR vs 100 nM LRG, p < 0,01). PN alone induced TRAP activity in 100% of scales (CTR vs 80 μM PN, p < 0.001) whereas 1 nM LTG suppressed PN-dependent TRAP activation (1 nM LTG + PN 80 μM vs PN 80 μM, p < 0.001, −90%). (B)Histochemical TRAP staining of scale treated with PN shows great resorption lacunae (purple staining) in all scales (100%) while only 10% of scales from 1 nM LTG+PN fish shows slight TRAP activity. (C) Biochemical TRAP analysis performed on scales confirms that 1 nM LTG treatment prevents the PN-dependent increase of TRAP activity (PN 80 μM vs CTR, p < 0.001, +99%; 1 nM LTG + PN 80 μM vs PN 80 μM, p < 0.001, −53%). (For interpretation of the references to color in this figure legend, the reader is referred to the Web version of this article.) |
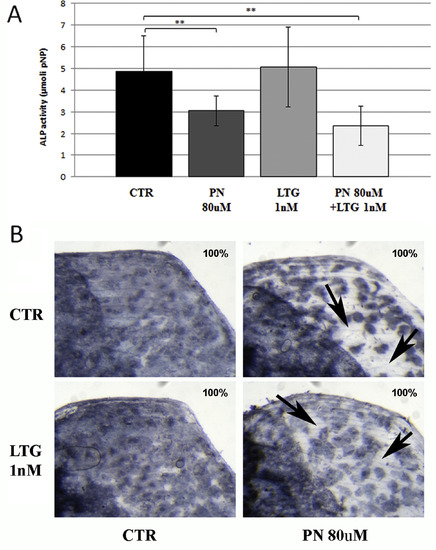
Biochemical and histochemical ALP assay in scales of fish treated with PN ± LTG. (A) In the biochemical ALP assay, PN reduces ALP activity in all the scales whereas co-treatment with 1 nM LTG does not alter this effect (PN 80 μM vs CTR, p < 0.01, −38%; 1 nM LTG vs CTR, p < 0.01, −52%). (B) Histochemical ALP analysis confirms the PN-induced reduction of ALP activity (black arrows) is not modulated by 1 nM LTG. The percentage indicates the fraction of the scales with that feature. |