
- Title
-
Neutrophil Swarming in Damaged Tissue Is Orchestrated by Connexins and Cooperative Calcium Alarm Signals
- Authors
- Poplimont, H., Georgantzoglou, A., Boulch, M., Walker, H.A., Coombs, C., Papaleonidopoulou, F., Sarris, M.
- Source
- Full text @ Curr. Biol.
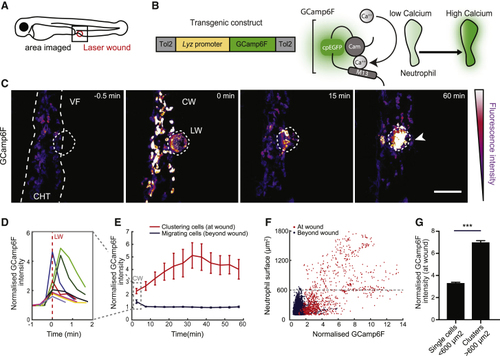
Calcium Dynamics in Neutrophils during Swarming (A) Schematic of a 3-day-post-fertilization (dpf) zebrafish larva showing the area of two-photon laser wound damage and imaging. (B) Construct expressing GCamp6F under the control of the lysozyme C promoter ( (C) Time-lapse sequence of two-photon confocal image projections showing neutrophils (color-coded for GCamp6F intensity) migrating from the caudal hematopoietic tissue (CHT) toward a laser wound (LW) (dotted line) at the ventral fin-CHT boundary (VF/CHT) in a Tg( (D) Quantification of mean GCamp6F intensity over time in all neutrophils in the field of view in the first 2 min post-wound. Intensity values were normalized to the mean intensity of segmented neutrophils prior to wound. Each line represents mean intensity per experimental larva. (E) Quantification of GCamp6F intensity over time in neutrophils clustering at the wound versus migrating neutrophils beyond the wound (dotted line in C). Intensity values were normalized as in (D). n = 8 larvae in 8 experiments. Dotted square denotes the time-bin corresponding to analysis in (D). (F) Normalized GCamp6F intensity in relation to the surface area of segmented neutrophils. Individual dots represent single neutrophils or clustered neutrophils at the wound (red) or migrating cells beyond the wound (blue). The maximum surface area for single neutrophils is indicated with dotted line. Data are from 8 larvae in 8 experiments. (G) Comparison of GCamp6F intensity in single (<600 μm2) versus clustering neutrophils (>600 μm2). n = 924 single cells and n = 347 clustered cells from 8 larvae in 8 experiments; Mann-Whitney test. In all panels, error bars represent SEM. ∗∗∗p < 0.0002. See also |
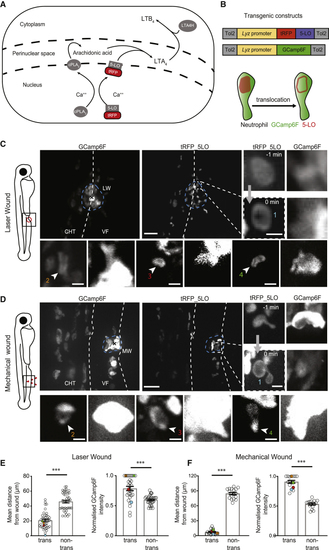
Activation of LTB4 Biosynthesis Is Favored in Clustering Neutrophils (A) Schematic of LTB4 biosynthesis. cPLA2 (calcium-dependent phospholipase A2) and 5-LO are recruited to the nuclear membrane and produce arachidonic acid (AA) and LTA4, respectively. LTA4 is metabolized into LTB4 by LTA4 hydrolase. (B) Constructs for transgenic expression of a fluorescent fusion of 5-LO with tRFP in neutrophils (below). Schematic of neutrophil with 5-LO nuclear translocation is shown. (C and D) Spinning-disk confocal projections of neutrophils in 3-dpf double-transgenic Tg( (E and F) Quantification of mean distance from the wound center (x; left) and normalized GCamp6F fluorescence intensity (right) for 5-LO-translocating cells versus non-translocating cells in laser wounds (E) and mechanical fin wounds (F). GCamp6F fluorescence intensity was normalized to the most fluorescent cell in the corresponding frame. (E) n = 41 cells (for translocating cells, each dot is a cell; for non-translocating cells, each dot represents the mean of all non-translocating cells in the same field of view; left) and n = 31 cells from 8 larvae in 5 different experiments (right). (F) n = 17 (left) and n = 16 (right) cells from 5 larvae in 3 different experiments. Colored dots represent examples shown in individual images in (D). Wilcoxon matched-pairs signed rank test. Error bar represents 95% confidence intervals of medians. ∗∗∗p < 0.0002. See also |
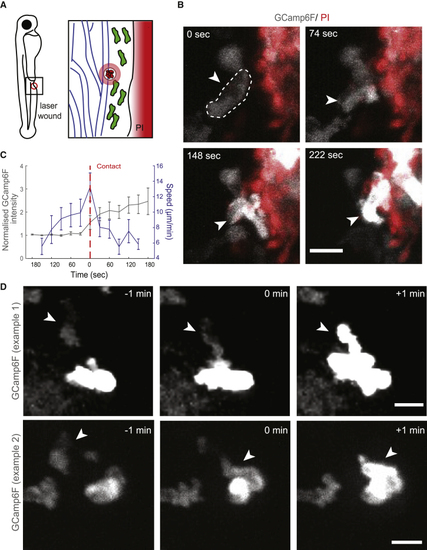
5-LO-Associated Calcium Fluxes Are Triggered upon Contact with Necrotic Cells or Neutrophils with Ongoing Fluxes (A) Schematic of two-photon laser wounding in the presence of propidium iodide (PI). (B) Time-lapse, two-photon confocal projection images of a GCamp6F-expressing (white) neutrophil (indicated with an arrow) entering a contact with PI+ cells/tissue (red) in a Tg( (C) Quantification of speed (blue) and normalized GCamp6F (gray) in neutrophils before and after contact with PI+ tissue. GCamp6F intensity was normalized as in (D) Examples of cell contacts transmitting calcium fluxes. Each case is represented by time-lapse images of a non-calcium-fluxing neutrophil (arrow) contacting a fluxing neutrophil. Time in minutes is indicated relative to cell-cell contact. Scale bar represents 10 μm. The quantification of neutrophil transmission of calcium fluxes is indicated in Error bars represent SEM. See also |
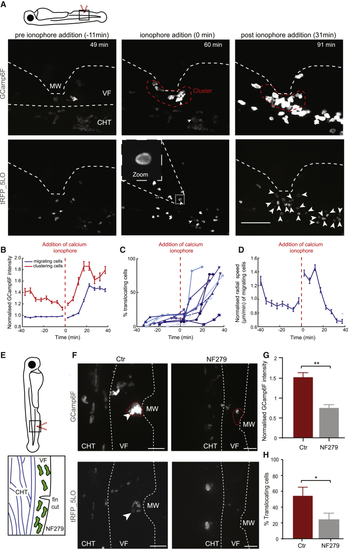
ATP-Gated Calcium Channels and Extracellular Calcium Entry Promote 5-LO-Capacitating Calcium Fluxes in Neutrophils (A) Spinning-disk confocal projections from neutrophils in Tg( (B) Normalized GCamp6F intensity over time in clustering versus migrating cells (cells within or beyond denoted red line in A). The time in relation to calcium ionophore addition is shown. n = 768–2,140 cells per bin (migrating) and n = 116–461 cells per bin (clustering) from 8 larvae in 3 experiments. (C) Percentage of 5-LO-translocating neutrophils out of all neutrophils visible in the field of view. Each line represents an individual larva; 8 larvae from 3 different experiments. (D) Normalized radial speed over time for migrating cells. n = 743–1,851 cells per bin from 8 larvae in 3 experiments. (E) Schematic of mechanical ventral fin wounding in the presence of NF279. Blue indicates vessels of the caudal vein plexus within the caudal hematopoietic site. (F) Spinning-disk confocal projection images of neutrophils in Tg( (G) Mean normalized GCamp6F intensity larvae treated or not with NF279. GCamp6F intensity was normalized as in (H) Percentage of translocating neutrophils out of all neutrophils recruited into the fin over 2 h. n = 7 control and n = 3 NF279-treated larvae from 3 and 2 experiments, respectively; Mann-Whitney test. Error bars represent SEM. ∗p < 0.03, ∗∗p < 0.002. See also |
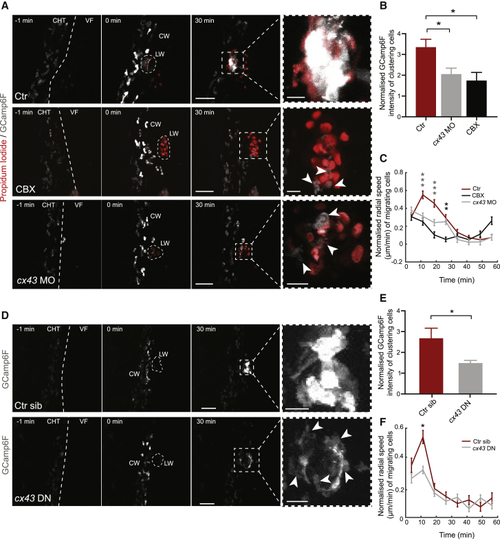
Neutrophil Cx43 Is Required for Intracluster Calcium Fluxes and Swarm Initiation (A) Time-lapse sequence of two-photon confocal image projections showing neutrophils in Tg( (B) Normalized GCamp6F levels in control (n = 8), CBX-treated larvae (n = 5), and (C) Neutrophil radial speed over time post-wounding for neutrophils in control, (D) Time-lapse sequence of two-photon confocal image projections showing neutrophils in Tg( (E) Normalized GCamp6F levels in neutrophils positive ( (F) Neutrophil radial speed over time post-wounding for neutrophils positive ( Error bars represent SEM. ∗p < 0.03, ∗∗p < 0.002, ∗∗∗p < 0.0002. See also |
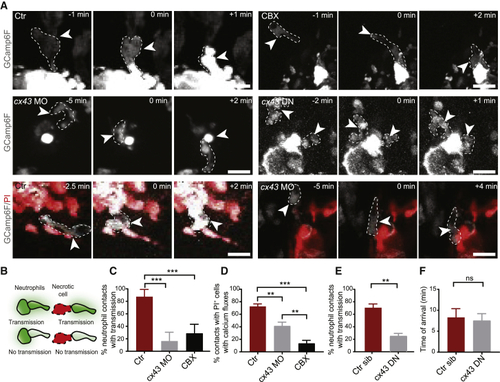
Neutrophil Cx43 Is Required for Autonomous and Cooperative Neutrophil Calcium Fluxes (A) Time-lapse images showing calcium fluxes in neutrophils (arrow) contacting other neutrophils or necrotic cells in control untreated, CBX-treated, or (B) Cartoon illustrates contacts between neutrophils and necrotic PI+ cells or between fluxing and non-fluxing neutrophils resulting or not in calcium flux transmission. (C and D) Percentage of neutrophil-neutrophil contacts (C) or neutrophil-PI+ cell contacts (D) resulting in transmission of calcium fluxes. Data are from Tg( (E) Percentage of contacts resulting in transmission of calcium fluxes in Tg( (F) Time point of arrival of first neutrophil at the wound in neutrophils positive ( Error bars represent SEM. ∗∗p < 0.002, ∗∗∗p < 0.0002. See also |
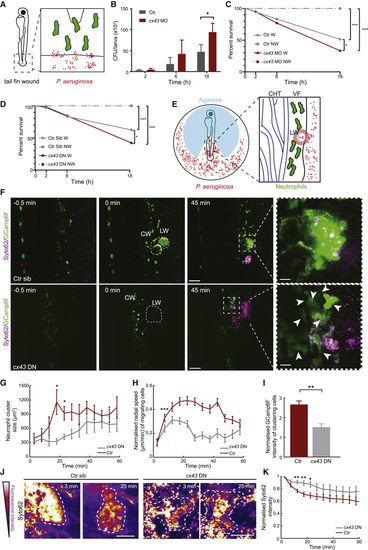
Cx43 Is Required for Maximal Wound Defense from Bacterial Invasion (A) Schematic of tail amputation and infection by PAO1 (B) Colony-forming units (CFUs) per larva in control wild-type (AB strain), non-injected larvae or (C) Survival over time in control wild-type, non-injected larvae or (D) Survival over time in Tg( (E) Schematic of imaging wound infection. Annotations are as in (F) Time-lapse sequence of two-photon confocal projections showing neutrophils in zebrafish larvae, positive ( (G) Neutrophil cluster size over time post-wounding in (H) Neutrophil radial speed over time post-wounding in (I) GCamp6F levels normalized as in (J) Images of the wound (dotted outline) pseudocolored for fluorescence intensity of Syto62-labeled PAO1 bacteria. Time post-wounding is indicated in minutes. Scale bar represents 25 μm. (K) Fluorescence intensity of bacteria at the wound relative to maximal initial intensity in this area. n = 5 Error bars represent SEM. ∗p < 0.03, ∗∗p < 0.002, ∗∗∗p < 0.0002. See also |