
|
Figure 2
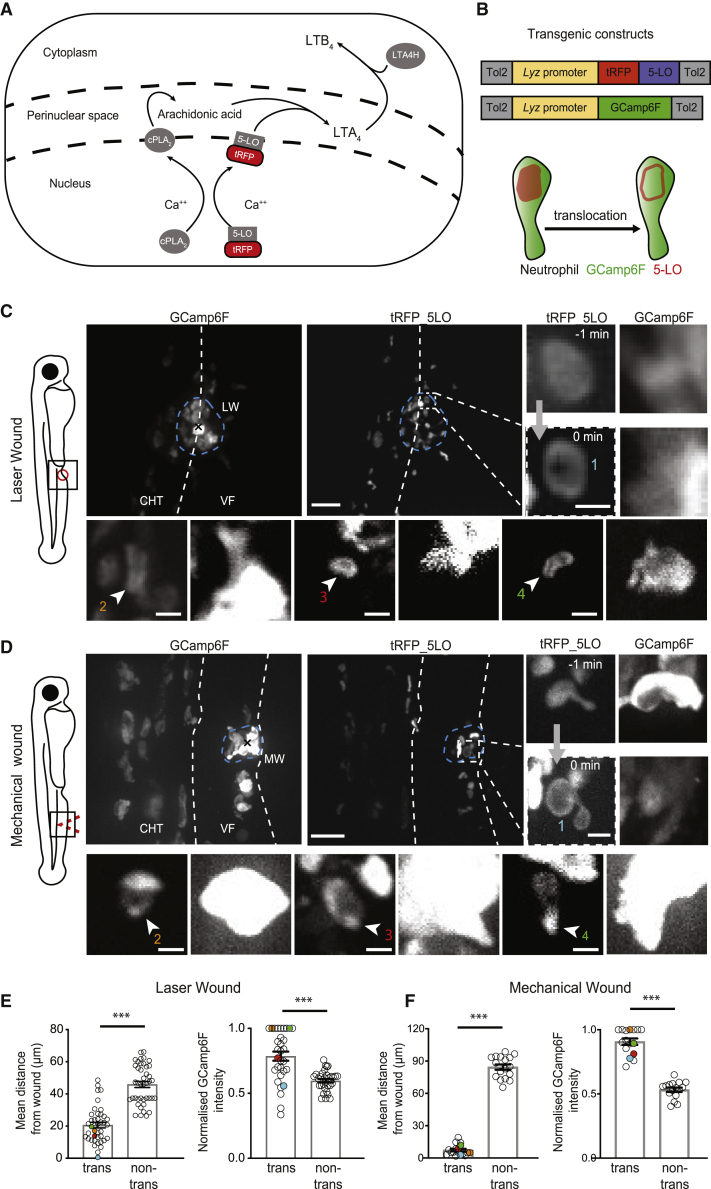
Activation of LTB4 Biosynthesis Is Favored in Clustering Neutrophils
(A) Schematic of LTB4 biosynthesis. cPLA2 (calcium-dependent phospholipase A2) and 5-LO are recruited to the nuclear membrane and produce arachidonic acid (AA) and LTA4, respectively. LTA4 is metabolized into LTB4 by LTA4 hydrolase.
(B) Constructs for transgenic expression of a fluorescent fusion of 5-LO with tRFP in neutrophils (below). Schematic of neutrophil with 5-LO nuclear translocation is shown.
(C and D) Spinning-disk confocal projections of neutrophils in 3-dpf double-transgenic Tg(
(E and F) Quantification of mean distance from the wound center (x; left) and normalized GCamp6F fluorescence intensity (right) for 5-LO-translocating cells versus non-translocating cells in laser wounds (E) and mechanical fin wounds (F). GCamp6F fluorescence intensity was normalized to the most fluorescent cell in the corresponding frame.
(E) n = 41 cells (for translocating cells, each dot is a cell; for non-translocating cells, each dot represents the mean of all non-translocating cells in the same field of view; left) and n = 31 cells from 8 larvae in 5 different experiments (right).
(F) n = 17 (left) and n = 16 (right) cells from 5 larvae in 3 different experiments. Colored dots represent examples shown in individual images in (D).
Wilcoxon matched-pairs signed rank test. Error bar represents 95% confidence intervals of medians. ∗∗∗p < 0.0002. See also