
- Title
-
Integration of Nodal and BMP Signaling by Mutual Signaling Effector Antagonism
- Authors
- Soh, G.H., Pomreinke, A.P., Müller, P.
- Source
- Full text @ Cell Rep.
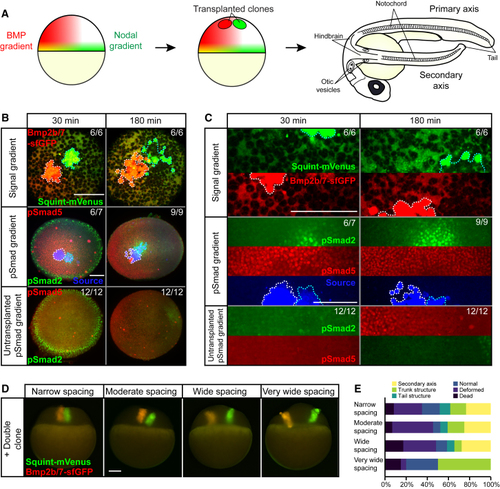
Secondary Axis Inducing Nodal and BMP Double Clones Produce a Localized Region of pSmad2 Activity Overlapping with a Broad Domain of pSmad5 Activity (A) Nodal and BMP form orthogonal overlapping gradients in zebrafish embryos. Transplanting ectopic sources of Nodal and BMP induces the formation of a secondary axis, which contains both anterior and posterior structures such as the hindbrain, otic vesicles, notochord, and tail. (B) Double clones of Bmp2b/7-sfGFP and Squint-mVenus imaged 30 min and 180 min post-transplantation. The first row depicts confocal microscopy images of Bmp2b/7-sfGFP (red) and Squint-mVenus (green). The second row shows light-sheet microscopy images of embryos immunostained with anti-pSmad2 (green) or anti-pSmad5 (red) antibodies as well as a cross-reactive anti-GFP antibody to detect Bmp2b/7-sfGFP and Squint-mVenus (blue). The third row shows comparable wild-type embryos. Nodal clones are traced in cyan and BMP clones are traced in white. Scale bar, 150 μm. (C) Higher magnification of images shown in (B) with separate fluorescent channels. Scale bar, 150 μm. (D) Images showing Nodal/BMP double clones with different spacings of transplanted cells taken immediately after transplantation. Scale bar, 150 μm. (E) Nodal/BMP double clones were transplanted with different spacings into blastula-stage zebrafish embryos: narrow (~0 μm between clones, n = 60), moderate (40–50 μm between clones, n = 44), wide (120–150 μm between clones, n = 29), and very wide (>170 μm between clones, n = 20). Narrow to wide spacings support the formation of secondary axes, whereas secondary axis formation fails with extremely wide spacing between Nodal and BMP clones. Quantification was performed at 24 h post-transplantation. |
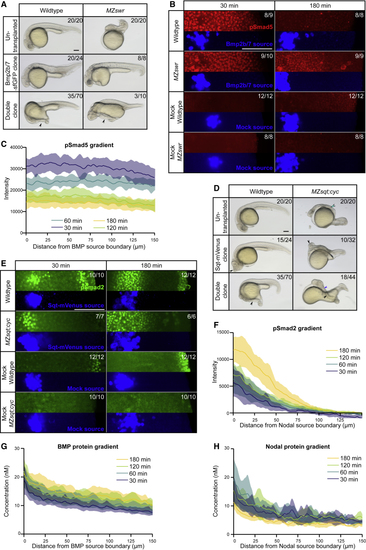
Nodal and BMP Form Similar Protein Gradients but Have Different Signaling Ranges during Secondary Axis Formation (A) Bmp2b/7-sfGFP as well as Squint-mVenus and Bmp2b/7-sfGFP double clones in wild-type or maternal-zygotic (B) Bmp2b/7-sfGFP clones compared to uninjected mock clones 30 min and 180 min post-transplantation in wild-type or (C) pSmad5 distributions in embryos with single Bmp2b/7-sfGFP clones in (D) Squint-mVenus as well as Squint-mVenus and Bmp2b/7-sfGFP double clones in wild-type or maternal-zygotic (E) Squint-mVenus clones compared to uninjected mock clones 30 min and 180 min post-transplantation in wild-type or (F) pSmad2 distributions in embryos with single Squint-mVenus clones in wild-type embryos at 30, 60, 120, and 180 min post-transplantation (n = 11 each). Shaded regions indicate 95% confidence intervals around the mean (lines). (G) BMP protein gradients in wild-type embryos with single Bmp2b/7-sfGFP clones at 30, 60, 120, and 180 min post-transplantation. The same embryos were imaged throughout the time course (n = 14). Fluorescence intensity was converted to concentration based on a calibration curve using recombinant sfGFP imaged with the same microscope settings. Shaded regions indicate 95% confidence intervals around the mean (lines). (H) Nodal protein gradients in wild-type embryos with single Squint-mVenus clones at 30, 60, 120, and 180 min post-transplantation. The same embryos were imaged throughout the time course (n = 12). Fluorescence intensity was converted to concentration based on a calibration curve using recombinant mVenus imaged with the same microscope settings. Shaded regions indicate 95% confidence intervals around the mean (lines). See also |
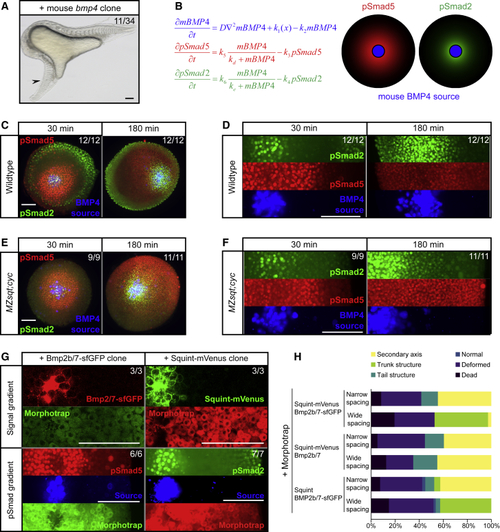
Different BMP and Nodal Signaling Ranges Arise from Differential Signaling Activation Kinetics (A) Single clones expressing mouse (B) Mathematical modeling shows that a difference in signaling activation kinetics could explain how a single gradient of mBMP4 induces pSmad5 and pSmad2 at different ranges. (C) Wild-type zebrafish embryos with clones expressing (D) Higher magnification of images shown in (C) with separated fluorescent channels. Scale bar, 150 μm. (E) (F) Higher magnification of images shown in (E) with separated fluorescent channels. Scale bar, 150 μm. (G) Zebrafish Bmp2b/7-sfGFP and Squint-mVenus clones in morphotrap-expressing wild-type embryos 30 min post-transplantation. Scale bar, 150 μm. (H) Double clones with fluorescently tagged or untagged zebrafish Nodal and BMP and with narrow or wide spacing were generated in morphotrap-expressing embryos. The frequency of the different structures induced by the clones was assessed 24 h post-transplantation. |
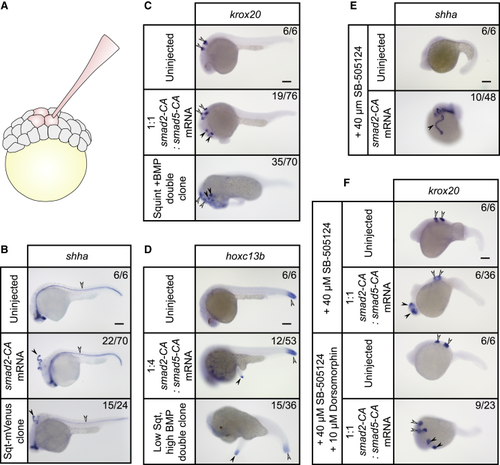
Ectopic Expression of Different Amounts of (A) Ectopic structures were generated by injecting three adjacent blastomeres in 64- to 128-cell-stage embryos. (B) The floorplate marker (C) (D) (E) (F) |
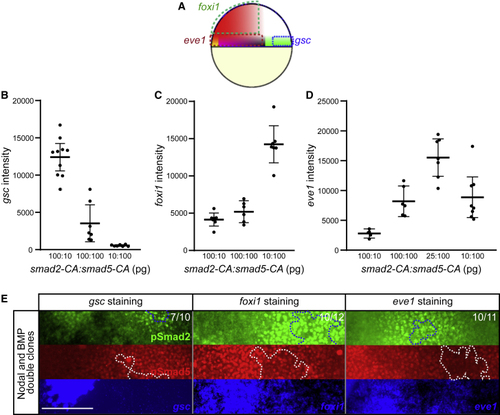
Mutual Antagonism of Smad2 and Smad5 for Specific Cell Fates (A) (B) Average (C) Average (D) Average (E) Embryos with Nodal and BMP double clones subjected to FISH with |
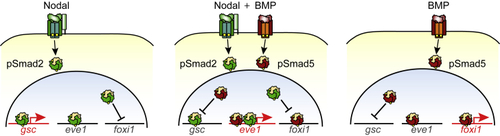
Selective Mutual Antagonism of pSmad2 and pSmad5 Allows Cells to Respond to Different Ratios of Nodal and BMP Signaling Schematic of a parsimonious model explaining the present findings. The antagonism of pSmad2 and pSmad5 to |