IMAGE

Figure 5

ID
ZDB-IMAGE-200424-5
Source
Figures for Soh et al., 2020
Image
Figure Caption

Figure 5

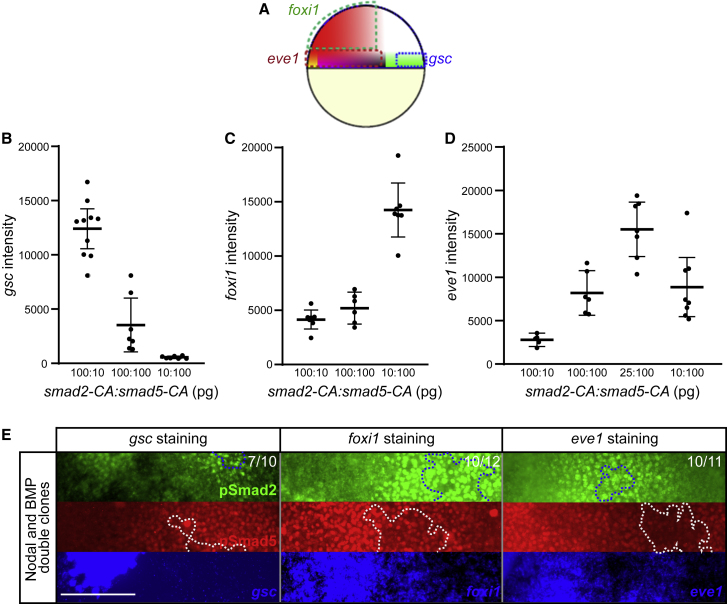
Mutual Antagonism of Smad2 and Smad5 for Specific Cell Fates

(A) gsc is expressed at the dorsal margin (Stachel et al., 1993), while foxi1 is expressed on the ventral side but excluded from the margin (Dal-Pra et al., 2006), and eve1 is expressed at the ventral margin (Joly et al., 1993) where Nodal and BMP signaling overlap (Figure 1A).

(B) Average gsc fluorescence in situ hybridization (FISH) intensity in 6-hpf embryos that were injected with the indicated smad2-CA and smad5-CA mRNA amounts at the one-cell stage (n = 10, 7, and 7).

(C) Average foxi1 FISH intensity in 6-hpf embryos that were injected with the indicated smad2-CA and smad5-CA mRNA amounts at the one-cell stage (n = 7, 6, and 7).

(D) Average eve1 FISH intensity of 6-hpf embryos that were injected with the indicated smad2-CA and smad5-CA mRNA amounts at the one-cell stage (n = 5, 6, 7, and 8).

(E) Embryos with Nodal and BMP double clones subjected to FISH with gsc (left, blue), foxi1 (middle, blue), or eve1 (right, blue) probes followed by pSmad2 (green) and pSmad5 (red) immunostaining. Blue dotted lines trace Nodal clones, and white dotted lines trace BMP clones. Scale bar, 150 μm. Error bars indicate 95% confidence intervals around the mean (horizontal lines) in (B)–(D).

Acknowledgments
This image is the copyrighted work of the attributed author or publisher, and ZFIN has permission only to display this image to its users. Additional permissions should be obtained from the applicable author or publisher of the image. Full text @ Cell Rep.