
- Title
-
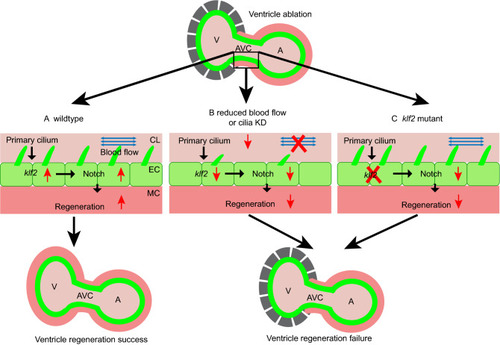
Primary cilia mediate Klf2-dependant Notch activation in regenerating heart
- Authors
- Li, X., Lu, Q., Peng, Y., Geng, F., Shao, X., Zhou, H., Cao, Y., Zhang, R.
- Source
- Full text @ Protein Cell
|
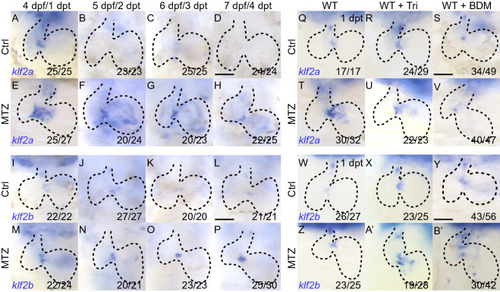
EXPRESSION / LABELING:
PHENOTYPE:
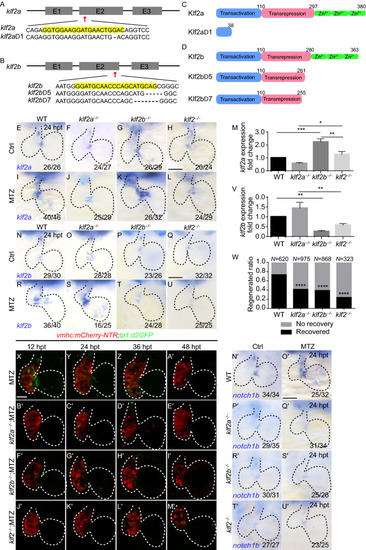
|
PHENOTYPE:
|
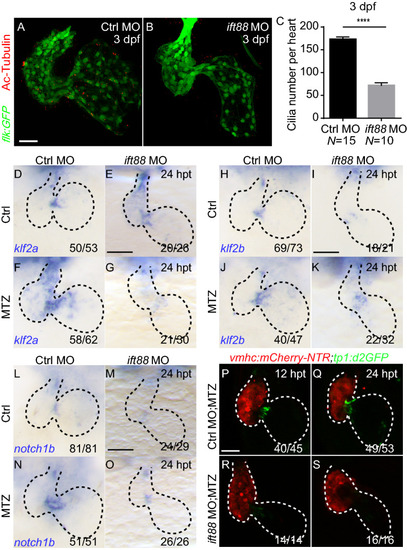
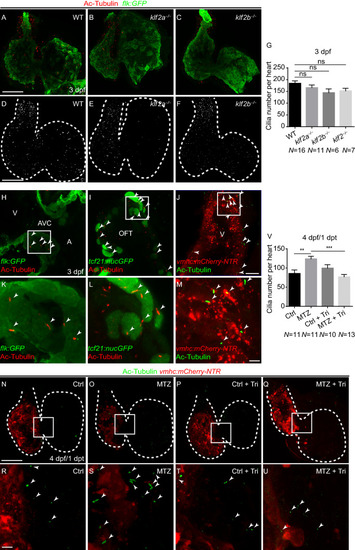
EXPRESSION / LABELING:
PHENOTYPE:
|
|