FIGURE SUMMARY
Title

Swimming motility of a gut bacterial symbiont promotes resistance to intestinal expulsion and enhances inflammation

Authors
Wiles, T.J., Schlomann, B.H., Wall, E.S., Betancourt, R., Parthasarathy, R., Guillemin, K.
Source
Full text @ PLoS Biol.

Loss of swimming motility or chemotaxis attenuates intestinal colonization and interbacterial competition.

(A) Abundances of wt Vibrio, Δmot, and Δche during monoassociation. Plotted are medians and interquartile ranges (n ≥ 17 animals/marker). Significant differences between each mutant and wt Vibrio determined by Mann-Whitney (purple asterisks: Δmot; cyan asterisks: Δche). ***p < 0.0001, **p = 0.0002. Inset shows median bacterial abundances in the water environment from each replicate experiment across all time points. (B) Experimental timeline of AeromonasVibrio competition. (C) Intestinal abundances of Aeromonas and wt or mutant Vibrio strains during different competition schemes. Aeromonas abundances while alone during monoassociation are shown for statistical comparison. Letters denote significant differences between Aeromonas treatments. Lines show paired Aeromonas and Vibrio abundances within individual fish. p < 0.05, Kruskal-Wallis and Dunn’s multiple comparisons test. Adjacent bars denote medians and interquartile ranges. Significant differences based on Wilcoxon between Aeromonas and each Vibrio strain are noted below each competition. (D) Abundances of wt and mutant Vibrios during competition with Aeromonas (from panel C) normalized to abundances during monoassociation at 24 hpi (from panel A). Bars denote medians and interquartile ranges. Significant differences determined by Mann-Whitney. Fold-decreases based on medians. Underlying data plotted in panels A, C, and D are provided in S1 Data. Aer, Aeromonas; hpi, hours post inoculation; wt, wild type.

Motility and chemotaxis mutants have altered intestinal spatial organization.

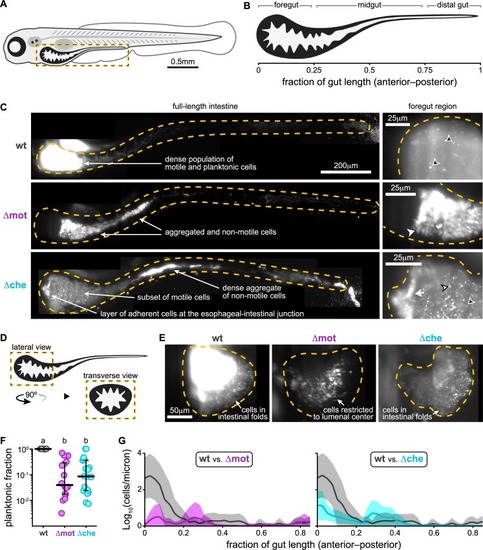
(A) Cartoon of a 6-day-old zebrafish. Dashed box marks intestinal region imaged by LSFM. (B) Anatomical regions of the larval zebrafish intestine. (C) Maximum intensity projections acquired by LSFM showing the spatial organization of wt Vibrio (top), Δmot (middle), and Δche (bottom) within the intestine. Top right inset shows a zoomed-in view of wt Vibrio cells in a separate fish that was colonized with a 1:100 mixture of green- and red-tagged variants so that the cellular organization of the dense Vibrio population could be discerned. The dilute channel (green) is shown. Dashed lines mark approximate intestinal boundaries. Open arrowheads: single bacterial cells; solid arrowheads: small aggregates; tailed arrowheads: large aggregates. Arrowheads with a black stroke mark swimming cells, which appear as comet-like streaks. (D) Cartoon showing the intestinal region pictured in panel E. (E) Maximum intensity projections acquired by LSFM showing transverse view of the foregut region colonized with wt, Δmot, or Δche. (F) Fraction of planktonic cells contained within each strain’s population. Each circle is a measurement from a single intestinal population. Bars denote medians and interquartile ranges. Letters denote significant differences. p < 0.05, Kruskal-Wallis and Dunn’s multiple comparisons test. (G) Image-derived abundances of wt (n = 7), Δmot (n = 4), and Δche (n = 5) with respect to position along the length of the gut. Shaded regions mark confidence intervals. Underlying data plotted in panels F and G are provided in S1 Data. LSFM, light sheet fluorescence microscopy; wt, wild type.

Swimming motility and chemotaxis promote persistence by enabling bacteria to counter intestinal flow and resist expulsion.

(A) Image-based quantification of abundances over time for wt Vibrio, Δmot, and Δche. Lines represent individual populations in individual fish. (B) Cultivation-based quantification of abundances for Δmot and Δche in co-housed ret−/− mutant hosts and wt/heterozygous sib. Abundances of wt Vibrio, Δmot, and Δche in wt hosts (from Fig 1A, 72 hpi) are shown for comparison. Bars denote medians and interquartile ranges. Letters denote significant differences. p < 0.05, Kruskal-Wallis and Dunn’s multiple comparisons test. Underlying data are provided in S1 Data. hpi, hours post inoculation; sib, sibling controls; wt, wild type.

Sustained swimming motility is required for maintaining intestinal spatial organization and persistence.

(A) Schematic of CRISPRi-based motility LOF switch. Lower left table summarizes switch activity and bacterial behaviors +/− aTc. Bent arrows denote promoters; “T” denotes transcriptional terminators. Solid lines represent constitutive interactions; dashed lines represent induced interactions. (B) Experimental timelines used to investigate in situ inactivation of swimming motility. (C) A maximum intensity projection acquired by LSFM of an animal colonized by VibriomotLOF at 6 hpi. Dashed line marks approximate intestinal boundaries. An arrowhead with a black stroke marks an area of swimming cells expressing only dTomato (magenta, “switch = OFF”). White tailed arrowheads mark aggregated cells (green, “switch = ON”). (D) Population center of mass over time for intestinal populations of wild-type Vibrio (gray) and VibriomotLOF (magenta/green). Lines are single bacterial populations within individual fish. Vertical dashed line marks time of aTc induction. (E) Abundances of VibriomotLOF at 24 and 48 hpi with aTc. Bars denote medians and interquartile ranges. Significant differences determined by Mann-Whitney. Underlying data plotted in panels D and E are provided in S1 Data. aTc, anhydrotetracycline; CRISPRi, CRISPR interference; hpi, hours post induction; LOF, loss-of-function; LSFM, light sheet fluorescence microscopy.

Acquisition of swimming motility or chemotaxis leads to rapid recovery of intestinal spatial organization and abundance.

(A) Schematic of the motility and chemotaxis GOF switches. Table summarizes switch activity and bacterial behaviors +/− aTc. (B) ΔmotGOF or ΔcheGOF abundances 24 hpi +/− aTc. ΔmotGOF and ΔcheGOF were preinduced overnight in liquid culture prior to inoculation; aTc was maintained in the water for continuous switch activation. Abundances of wild-type Vibrio, Δmot, and Δche in wild-type hosts (from Fig 1A, 24 hpi) are shown for comparison. Bars denote medians and interquartile ranges. Letters denote significant differences. p < 0.05, Kruskal-Wallis and Dunn’s multiple comparisons test. (C) Probability densities showing the spatial distributions of ΔmotGOF and ΔcheGOF at 24 hpi. Magenta = uninduced; green = induced. Shaded regions mark standard errors. Sample sizes (populations within individual animals): ΔmotGOF “OFF”, n = 5; ΔmotGOF “ON”, n = 7, ΔcheGOF “OFF”, n = 6; ΔcheGOF “ON”, n = 6. (D) Maximum intensity projections acquired by LSFM from the same animal showing ΔcheGOF undergoing rapid changes in spatial organization following induction. Dashed lines mark approximate intestinal boundary. (E) Abundances of ΔmotGOF and ΔcheGOF over time. Magenta and green circles indicate abundances +/− aTc, respectively. Plotted are medians and interquartile ranges (n ≥ 19 animals/marker). Abundances of wild-type Vibrio, Δmot, and Δche (from Fig 1A) are shown for comparison. Significant differences between each mutant and wild-type determined by Mann-Whitney (magenta asterisks: uninduced; green asterisks: induced). ***p < 0.0001. Underlying data plotted in panels B, C, and E are provided in S1 Data. aTc, anhydrotetracycline; GOF, gain-of-function; hpi, hours post induction; LSFM, light sheet fluorescence microscopy; ns, not significant.

Motile bacterial cells induce local and systemic <italic>tnfa</italic> expression.

(A) Maximum intensity projections acquired by LSFM of the foregut region of tnfa:GFP transgenic zebrafish raised germ-free, with a complex microbial community (conventionalized), or colonized solely with dTomato-expressing (magenta) wild-type Vibrio, Δmot, or Δche. Animals were imaged at 24 hpi. Dashed lines mark the approximate intestinal boundaries. Empty arrowheads mark host cells with tnfa:GFP reporter activity. Solid arrowheads mark tnfa:GFP reporter activity in extraintestinal tissues in or near the liver. (B) Percent of zebrafish subjected to different colonization regimes with tnfa:GFP activity in or near the liver; >6 animals/group were blindly scored by 3 researchers. Bars denote medians and interquartile ranges. (C) Total GFP fluorescence intensity across the foregut region normalized to median gf fluorescence intensity. Bars denote medians and interquartile ranges. Letters denote significant differences. p < 0.05, Kruskal-Wallis and Dunn’s multiple comparisons test. (D) Maximum intensity projections acquired by LSFM of the foregut region of a tnfa:GFP, mpeg1:mCherry (magenta) transgenic zebrafish colonized with dTomato-expressing wild-type Vibrio (magenta). Animal was imaged at 24 hpi. Open arrowhead indicates a tnfa+/mpeg1+ cell. Underlying data plotted in panels B and C are provided in S1 Data. cvz, conventionalized; gf, germ-free; GFP, green fluorescent protein; hpi, hours post inoculation; LSFM, light sheet fluorescence microscopy.

Host tissues rapidly respond to sudden increases in bacterial swimming motility within the intestine.

(A) Maximum intensity projections acquired by LSFM of the foregut region of separate tnfa:GFP transgenic zebrafish colonized with ΔmotGOF (magenta). Dashed lines mark approximate intestinal boundaries. Times are hours post switch induction. Solid arrowhead marks bacterial aggregates, empty arrowhead marks single bacterial cells. (B) Percent of zebrafish subjected to different colonization regimes with tnfa:GFP activity in or near the liver; >4 animals/group were blindly scored by 3 researchers. Bars denote medians and interquartile ranges. Data from animals colonized with wt Vibrio or Δmot (from Fig 6B) are shown for comparison. Horizontal dashed lines mark gf range plotted in Fig 6B. (C) Total GFP fluorescence intensity across the foregut region normalized to median gf fluorescence intensity plotted in Fig 6C; horizontal dashed lines mark gf range. Bars denote medians and interquartile ranges. Data from animals colonized with wt Vibrio or Δmot (from Fig 6C) are shown for comparison. Letters denote significant differences. p < 0.05, Kruskal-Wallis and Dunn’s multiple comparisons test. Underlying data plotted in panels B and C are provided in S1 Data. gf, germ-free; GFP, green fluorescent protein; LSFM, light sheet fluorescence microscopy; wt, wild type.

Acknowledgments
This image is the copyrighted work of the attributed author or publisher, and ZFIN has permission only to display this image to its users. Additional permissions should be obtained from the applicable author or publisher of the image. Full text @ PLoS Biol.