IMAGE

Fig 7

ID
ZDB-IMAGE-200412-9
Source
Figures for Wiles et al., 2020
Image
Figure Caption

Fig 7 Host tissues rapidly respond to sudden increases in bacterial swimming motility within the intestine.

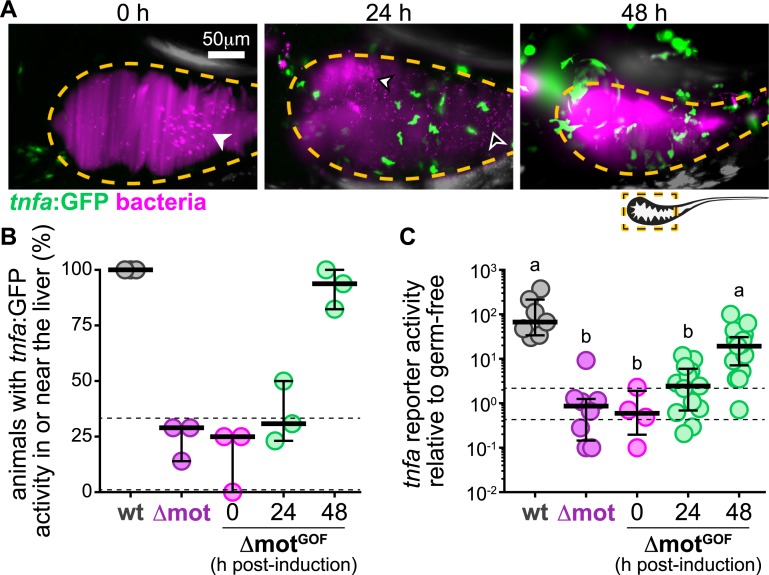
(A) Maximum intensity projections acquired by LSFM of the foregut region of separate tnfa:GFP transgenic zebrafish colonized with ΔmotGOF (magenta). Dashed lines mark approximate intestinal boundaries. Times are hours post switch induction. Solid arrowhead marks bacterial aggregates, empty arrowhead marks single bacterial cells. (B) Percent of zebrafish subjected to different colonization regimes with tnfa:GFP activity in or near the liver; >4 animals/group were blindly scored by 3 researchers. Bars denote medians and interquartile ranges. Data from animals colonized with wt Vibrio or Δmot (from Fig 6B) are shown for comparison. Horizontal dashed lines mark gf range plotted in Fig 6B. (C) Total GFP fluorescence intensity across the foregut region normalized to median gf fluorescence intensity plotted in Fig 6C; horizontal dashed lines mark gf range. Bars denote medians and interquartile ranges. Data from animals colonized with wt Vibrio or Δmot (from Fig 6C) are shown for comparison. Letters denote significant differences. p < 0.05, Kruskal-Wallis and Dunn’s multiple comparisons test. Underlying data plotted in panels B and C are provided in S1 Data. gf, germ-free; GFP, green fluorescent protein; LSFM, light sheet fluorescence microscopy; wt, wild type.

Acknowledgments
This image is the copyrighted work of the attributed author or publisher, and ZFIN has permission only to display this image to its users. Additional permissions should be obtained from the applicable author or publisher of the image. Full text @ PLoS Biol.