FIGURE SUMMARY
Title

Perceptual mechanisms of social affiliation in zebrafish

Authors
Nunes, A.R., Carreira, L., Anbalagan, S., Blechman, J., Levkowitz, G., Oliveira, R.F.
Source
Full text @ Sci. Rep.

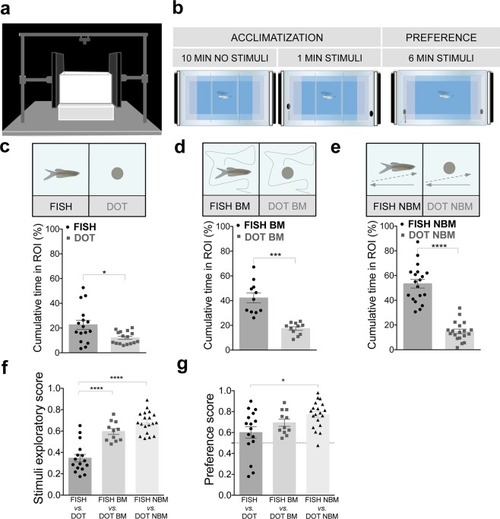
Conspecific form promotes zebrafish social affiliative behaviors. (a) Schematic of the behavioral setup. (b) Schematic of the experimental protocol: a focal fish is placed in the center of the experimental tank for an acclimatization phase, having visual access to two screens placed in each side of the tank, where an image of an empty tank is presented (background image). After 10 min, the stimulus appears in the screens for 1 min, then the partitions are lifted, and fish is allowed to explore the tank for 6 min (preference phase). The time spent in each side of the tank (ROI) is taken as a preference for the respective stimulus. (c) Zebrafish is allowed to choose between a static image of a fish vs. a static image of a dot. % Cumulative time fish spent near static fish image (FISH, black dots) vs. dot (DOT, grey squares, n = 16). (d) Zebrafish is allowed to choose between a fish vs. a dot moving with biological motion. % Cumulative time fish spent near fish with biological motion (FISH BM, black dots) vs. dot with biological motion (DOT BM, grey squares, n = 11). (e) Zebrafish is allowed to choose between a fish vs. a dot moving with non-biological motion. % Cumulative time fish spent near fish with non-biological motion (FISH NBM, black dots) vs. dot with non-biological motion (DOT NBM, grey squares, n = 19). (f) Motion increases the stimuli exploration. Comparison of the exploratory score between the experiments above described (stimuli exploratory score  =  time spent in both stimuli over total time). (g) Zebrafish preference towards conspecific form increases with motion. Comparison of the preference score (time spent in the conspecific form over time spent near both stimuli), between the experiments above described. Error bars indicate SEM. *P < 0.05, ***P < 0.001, ****P < 0.0001.

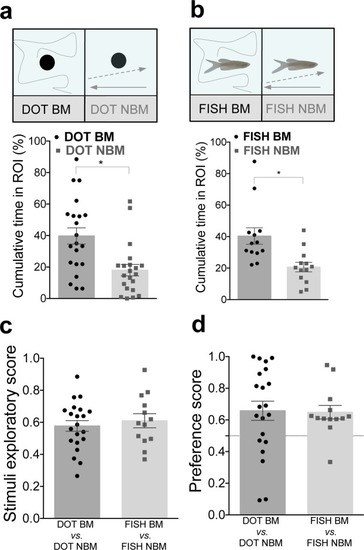
Biological motion promotes zebrafish social affiliative behaviors. (a) Zebrafish prefers to associate with a dot with biological motion (DOT BM) than non-biological motion (DOT NBM). % Cumulative time fish spent near DOT BM (black dots) vs. DOT NBM (grey squares, n = 21). (b) Zebrafish prefers to associate with a fish with biological motion (FISH BM) than a fish with non-biological motion (FISH NBM). % Cumulative time fish spent near FISH BM (black dots) vs. FISH NBM (grey squares, n = 13). (c) Comparison of the exploratory score between the experiments above described. (d) Comparison of the preference score towards biological motion between the experiments above described. Error bars indicate SEM. *P < 0.05.

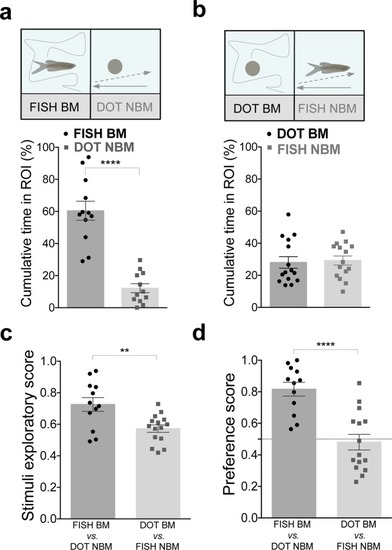
Congruent social stimuli promote social preference. (a) Zebrafish has a strong preference towards congruent social stimuli. % Cumulative time fish spent next to FISH BM (black dots) vs. DOT NBM (grey squares, n = 12). (b) Zebrafish does not exhibit preference for mismatched social stimuli. % Cumulative time fish spent next to DOT BM (black dots) vs. FISH NBM (grey squares, n = 15). (c) Zebrafish explores more the congruent than incongruent stimuli. Comparison of the stimuli exploratory score between congruent and incongruent stimuli. (d) Zebrafish prefers more the congruent than incongruent stimuli. Comparison of the preference score between social congruent and incongruent stimuli. Error bars indicate SEM. **P < 0.01, ****P < 0.0001.

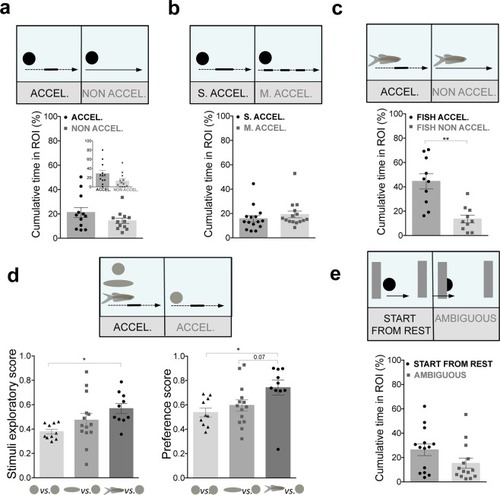
Zebrafish perceives elementary cues of biological motion and shape enhances this preference. (a) Zebrafish preference towards speed-changes (acceleration) cues. % Cumulative time fish spent next to a dot with speed-changes cues (ACCEL., black dot) vs. constant mean speed cue (NON ACCEL., grey squares) (n = 12). Depict of the % cumulative time in ROI during the first 2 min of the trial is shown. (b) Increasing the moments of acceleration do not increase preference towards speed-changes. % Cumulative time fish spent next to a single speed change (S.ACCEL., black dots) vs. multiple speed-changes (M. ACCEL., grey squares, n = 15). (c) Conspecific shape enhances attraction to speed-change cues. % Cumulative time fish spent next to a fish image with speed-changes (FISH ACCEL., black dots) vs. constant speed (FISH NON ACCEL., grey squares, n = 10). (d) Shape enhances attraction to acceleration cues. Changing from dot to elongated shape, and to conspecific form increases stimuli exploratory score and preference score. (e) Zebrafish preference towards start from rest cues. % Cumulative time fish spent next to a start from rest stimulus (START FROM REST, black dots) vs. an ambiguous stimulus (grey squares, n = 14). Error bars indicate SEM. *P < 0.05, **P < 0.01.

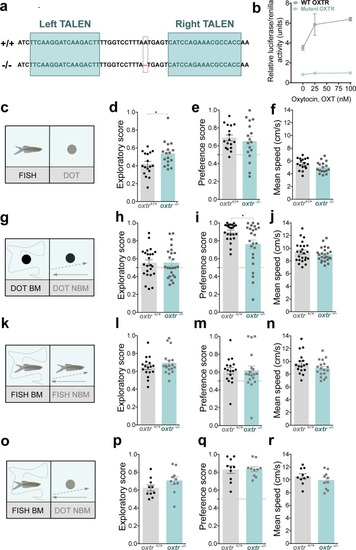
Oxytocin signaling is differently involved in the perception of biological motion and conspecific form. (a) Generation of germline transmitting oxtr mutant. TALEN sites targeting the 1st exon of the oxtr gene. Single bp mutation generates a truncated receptor. (b) Different concentrations of synthetic isotocin, also known as oxytocin in fish literature, increased cAMP reporter activity of the WT-transfected OXTR, but not the mutant. (c) WT (oxtr(+/+)) and oxtr mutant (oxtr(−/−)) fish are allowed to choose between a static fish image (FISH) vs. a static dot (DOT). (d) Comparison of exploratory score between oxtr(+/+) (grey bars, n = 17) and oxtr(−/−) (cyan bars, n = 16). (e) Comparison of preference score towards social cues between oxtr(+/+) (grey bars, n = 17) and oxtr(−/−) (cyan bars, n = 16). (f) Comparison of mean speed between oxtr(+/+) (grey bars, n = 17) and oxtr(−/−) (cyan bars, n = 16). (g) Fish oxtr(+/+) and oxtr(−/−) are allowed to choose between a dot moving with biological motion (DOT BM) vs. a non-biological motion (DOT NBM). (h) Comparison of exploratory score between oxtr(+/+) (grey bars, n = 24) and oxtr(−/−) (cyan bars, n = 24). (i) Comparison of preference score towards social cues between oxtr(+/+) (grey bars, n = 24) and oxtr(−/−) (cyan bars, n = 24). (j) Comparison of mean speed between oxtr(+/+) (grey bars, n = 24) and oxtr(−/−) (cyan bars, n = 24). (k) Fish oxtr(+/+) and oxtr(−/−) are allowed to choose between a fish moving with biological motion (FISH BM) vs. a fish image moving with non-biological motion (FISH NBM). (l) Comparison of exploratory score between oxtr(+/+) (grey bars, n = 17) and oxtr(−/−) (cyan bars, n = 18). (m) Comparison of preference score towards social cues between oxtr(+/+) (grey bars, n = 17) and oxtr(−/−) (cyan bars, n = 18). (n) Comparison of mean speed between oxtr(+/+) (grey bars, n = 17) and oxtr(−/−) (cyan bars, n = 18). (o) Fish oxtr(+/+) and oxtr(−/−) are allowed to choose between a fish moving with biological motion (FISH BM) vs. a dot with non-biological motion (DOT NBM). (p) Comparison of exploratory score between oxtr(+/+) (grey bars, n = 10) and oxtr(−/−) (cyan bars, n = 10). (q) Comparison of preference score towards social cues between oxtr(+/+) (grey bars, n = 10) and oxtr(−/−) (cyan bars, n = 10). (r) Comparison of mean speed between oxtr(+/+) (grey bars, n = 10) and oxtr(−/−) (cyan bars, n = 10). Error bars indicate SEM. *P < 0.05.

Acknowledgments
This image is the copyrighted work of the attributed author or publisher, and ZFIN has permission only to display this image to its users. Additional permissions should be obtained from the applicable author or publisher of the image. Full text @ Sci. Rep.