FIGURE SUMMARY
Title

A single cell transcriptome atlas of the developing zebrafish hindbrain

Authors
Tambalo, M., Mitter, R., Wilkinson, D.G.
Source
Full text @ Development

High-throughput scRNA-seq strategy from the developing hindbrain. (A) The hindbrain of 16 hpf (pink), 24 hpf (green) and 44 hpf (blue) embryos was collected for scRNA-seq. (B) Drawing of zebrafish hindbrain with a closer view of the stereotypical hindbrain cell composition at 44 hpf. Progenitors and radial glia cell bodies occupy the ventricular region, while differentiating progenitors and neurons are in the mantle zone. (C) Schematic of the 10X Genomics Chromium workflow.

Cell population composition and signatures of the 16 hpf hindbrain. (A) An unsupervised UMAP plot subdivides hindbrain cells into 10 clusters (C0-C9). Dotted lines segregate different rhombomeres (r), midbrain-hindbrain boundary (MHB), floor plate (FP), roof plate (RP) and cells undergoing neurogenesis are also highlighted. The red line separates dorsal versus ventral cells. UMAP2 (y-axis) is discontinuous. Below the UMAP, a schematic view of the zebrafish hindbrain at 16 hpf and selected segmental genes. (B) Heatmap of the top 30 genes significantly enriched in each cluster; representative gene names are shown close to each cluster. The full gene list is in Fig. S3. (C) UMAP plots showing the log normalised counts of representative genes. Colour intensity is proportional to the expression level. Arrowheads indicate the relevant domain of expression; colour refers to cluster of origin. (D) Summary of rhombomere-specific genes extracted from the top 30 significantly enriched. (E) Summary of genes restricted along the D-V axis.

Cell population composition and signatures of the 24 hpf hindbrain. (A) Unsupervised UMAP plot subdivides hindbrain cells into 15 clusters. Dotted lines segregate dorsal (dark violet), medial (pink) and ventral (maroon) progenitors; red arrowed lines indicate the D-V axis and the direction of neurogenesis. Below the UMAP, a schematic drawing of a representative transverse section of a 24 hpf zebrafish hindbrain at the level of the otic vesicle (DP, dorsal progenitors; MP, medial progenitors; VP, ventral progenitors; pMN, progenitors motor neurons; DN, dorsal neurogenesis; MN, medial neurogenesis; VN, ventral neurogenesis; FP, floor plate; RP, roof plate). (B) Heatmap of the top 30 genes significantly enriched in each cluster; representative gene names are shown close to each cluster. The full gene list is in Fig. S5. (C) UMAP plots showing the log normalised counts of selective representative genes. Colour intensity is proportional to the expression level of a given gene. Arrowheads indicate the relevant domain of expression; colour refers to cluster of origin. (D) Dot plot of genes with dorsoventral restricted expression in progenitors. (E) Dot plot of factors with restricted expression in differentiating progenitors. Dot size corresponds to the percentage of cells expressing the feature in each cluster, while the colour represents the average expression level. Whole-mount in situ hybridisation showing the expression pattern of atoh1a (F,F′), ascl1a (G,G′) and neurog1 (H,H′). (F-H) Dorsal view and (F′-H′) 40 µm hindbrain transverse section at the level of r4-r5/r5-r6. Scale bars: 50 µm.

Neuronal complexity of the 44 hpf hindbrain. (A) An unsupervised UMAP plot subdivides cells into 16 clusters. Red arrowed line indicates the D-V axis. Below the UMAP is a schematic drawing of a representative transverse section of a 44 hpf zebrafish hindbrain at the level of the otic vesicle (PP, proliferative progenitors; DMP, dorsomedial progenitors; VP, ventral progenitors; MVN, medio-ventral neurogenesis; DN, dorsal neurogenesis; dB4, GABAergic interneurons; NAN, noradrenergic neurons; dA1, dorsal neurons; N, neurons; VN, ventral neurons; V2, interneurons; MN, motor neurons; FP, floor plate; NM, neuromast). (B) Heatmap of the top 30 genes significantly enriched in each cluster, representative gene names are shown close to each cluster. For the full gene list, refer to Fig. S6. (C) UMAP plots showing the log normalised counts of selective representative genes. Colour intensity is proportional to the expression level of a given gene. Arrowheads point to the relevant domain of expression; colour refers to cluster of origin. (D) Dot plot showing neuronal subtype molecular signature. Dot size corresponds to the percentage of cells expressing the feature in each cluster, while the colour represents the average expression level. Whole-mount in situ hybridisation showing the expression pattern of barhl2 (E,E′), pax2 (F,F′), otpb (G,G′) and tal1 (H-H′). (E-H) Dorsal view, (E′-H′) lateral view and (E″-H″) 40 µm hindbrain transverse section at the level of r4-r5/r5-r6. Scale bars: 50 µm.

Analysis of aggregated 16 hpf, 24 hpf and 44 hpf data. (A) Unsupervised UMAP plot of cells from 16 hpf, 24 hpf and 44 hpf subdivides them into 12 clusters (DP, dorsal progenitors; VMP, ventral-medial progenitors; FP, floor plate). (B) UMAP plots with cells coloured based on their stage of origin: 16 hpf (pink), 24 hpf (green) and 44 hpf (blue). (C) Dot plot showing molecular signature of dorsal and ventral progenitors at the three stages. Dot size corresponds to the percentage of cells expressing the feature in each cluster, while the colour represents the average expression level. The full gene list of top 30 significantly enriched factors is in Fig. S8. (D) UMAP plots showing the log normalised counts of representative genes. Colour intensity is proportional to the expression level of a given gene. Whole-mount in situ hybridisation showing the expression pattern of cldn5a, fstl1a, mki67, fabp7a, atp1b4 and CU929451.2 (miR9.3) at 24 hpf and 44 hpf. Arrowheads indicate relevant domains of expression; colour refers to the cluster of origin. Dorsal view (DV), side view (SV) and 40 µm hindbrain transverse section (TS) at the level of r4-r5/r5-r6 are shown for each gene. Scale bars: 50 µm. EN, early neurogenesis; EP, early progenitors; DC, differentiating cells; DP, dorsal progenitors; NAP, non-apical proliferation; G, glia. (E) Selected Gene Ontology (GO) terms at 16 hpf (pink), 24 hpf (green) and 44 hpf (blue) are shown. x-axis is -log10 (P-value). (F) Summary of global hindbrain changes along the temporal axis.

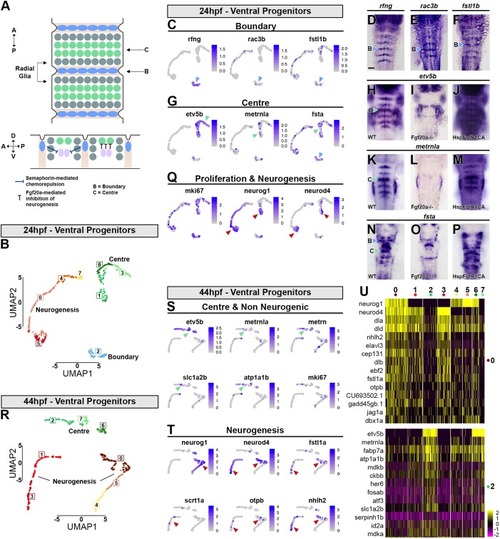
Transcriptional signature of boundary cells and segment centre progenitors. (A) Schematic drawing representing anterior-posterior organisation within hindbrain segments. Boundary cells are in blue, neurogenic progenitors in grey and segment centre cells in green. Below is a side view showing the role of boundary cells in maintaining Fgf20a neurons (pink) at the centre of each segment, mediated by semaphorins. Fgf20 signalling maintains undifferentiated progenitors. (B) Supervised clustering of 24 hpf ventral progenitors. Eight clusters are identified: C7, C4 and C0 are progenitors; C5 is the neurogenic domain; C2 are boundary cells; and C1, C6 and C3 are segment centre progenitors. (C,G,Q) UMAP plots showing the expression distribution of boundary (C), segment centre (G) and proliferation and neurogenic genes (Q). Arrowheads indicate relevant domain of expression; colour refers to cluster of origin. (D-F,H,K,N) Whole-mount in situ hybridisation of boundary (D-F) and segment centre genes (H,K,N). (I,J,L,M,O,P) Segment centre-specific gene expression is dependent on Fgf20 signalling, as fgf20a−/− embryos have loss of etv5b (I), metrnla (L) and fsta (O) expression, whereas constitutive activation of FgfR1 induces their ectopic expression (J,M,P). (R) Supervised clustering of 44 hpf ventral progenitors. Eight clusters are identified: C4 and C5 are progenitors; C0, C1 and C3 are neurogenic domains; C2, C7 and C6 are segment centre progenitors. (S,T) UMAP plots showing the expression distribution of segment centre and non-neurogenic genes (S) and neurogenic genes (T). Arrowheads indicate relevant domain of expression; colour refers to cluster of origin. (U) Heatmap of the top 15 genes enriched in each cluster.

Analysis of transcription factor expression during hindbrain neurogenesis. (A) Monocle3 pseudo-temporal ordering of 16 hpf, 24 hpf and 44 hpf hindbrain cells superimposed onto the aggregate UMAP. Cells are coloured based on their progression along pseudotemporal space (from pseudotime 0 in violet to the end of differentiation in yellow). (B) Individual pseudotemporal plots representing cell distribution at each developmental stage. (C) Heatmap showing selected TFs clustered by pseudotemporal expression pattern (q values<0.01). Pseudotime ordering is from left (progenitor state) to right (differentiated neurons). Selected transcription factors are shown for each group (G1-G7). The full gene list is in Fig. S13. (D-F) Expression of scrt1a, scrt1b and scrt2 during pseudotime. Whole-mount in situ hybridisation at 44 hpf for Scratch genes is shown in dorsal view (D′-F′), side view (D″-F″) and hindbrain sections (D‴-F‴). Scale bars: 50 µm. VN, ventral neurogenesis; DN, dorsal neurogenesis. (G) Using GENIE3, a directed network of interactions was predicted among the genes in the 44 hpf scRNA-seq dataset. The Scratch genes network was viewed and extracted in Cytoscape; boxes highlight TFs present in the above heatmap and colours match the group of origin in C.

Acknowledgments
This image is the copyrighted work of the attributed author or publisher, and ZFIN has permission only to display this image to its users. Additional permissions should be obtained from the applicable author or publisher of the image. Full text @ Development