
Fig. 2.
- ID
- ZDB-IMAGE-200410-4
- Publication
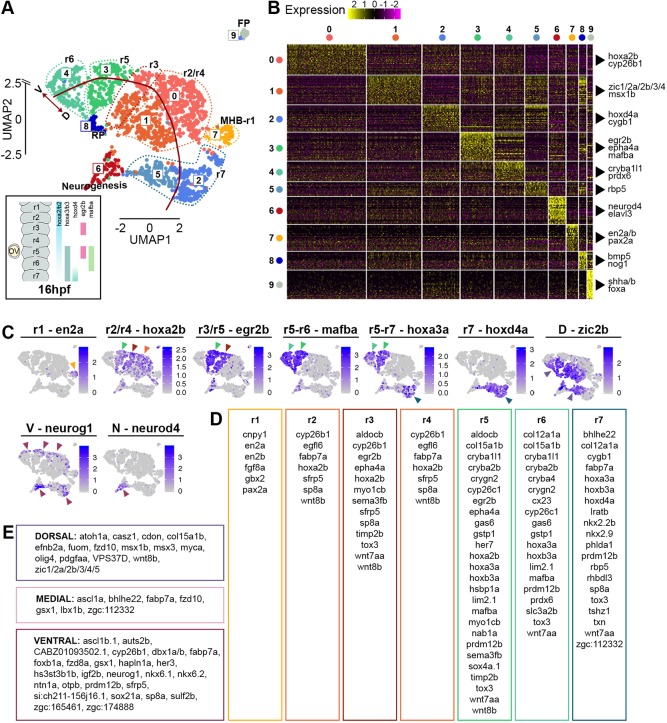
- Tambalo et al., 2020 - A single cell transcriptome atlas of the developing zebrafish hindbrain
- All Figures
- Figures for Tambalo et al., 2020
|
Fig. 2.