FIGURE SUMMARY
Title

Phage Lytic Protein LysRODI Prevents Staphylococcal Mastitis in Mice

Authors
Gutiérrez, D., Garrido, V., Fernández, L., Portilla, S., Rodríguez, A., Grilló, M.J., García, P.
Source
Full text @ Front Microbiol

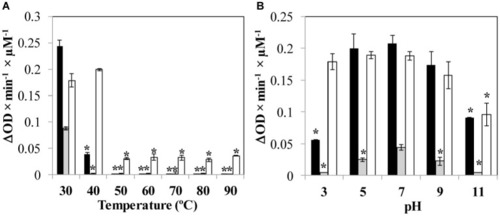
Influence of environmental parameters
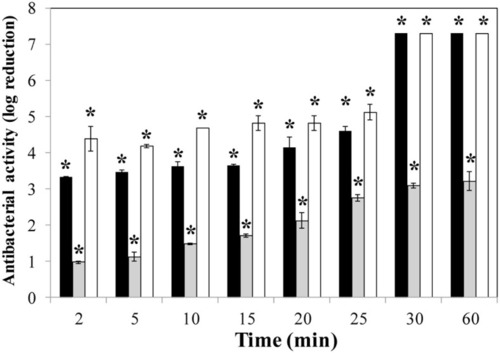
 (A) temperature and (B) pH on protein activity. Specific lytic activity of the proteins is calculated against S. aureus Sa9. Bars represent the activity (ΔDO600 × min−1 × μM−1) of each protein (LysRODI, black; LysA72, gray and CHAPSH3b white). Data are the mean ± standard deviation of three biological replicates. Asterisks indicate statistical differences (p < 0.05; Student’s t-test) between the specific lytic activity when the protein is submitted to the temperature or pH treatment with the activity observed when the protein is tested at 37°C in NaPi buffer, pH = 7.4. The data were expressed as the mean ± standard deviation of three biological replicates.

Time-kill curve of S. aureus Sa9 treated with equimolar amounts (0.1 μM) of proteins (LysRODI, black; LysA72, gray and CHAPSH3b white). Results (means ± standard deviation of three replicates) are reported as bacterial reduction quantified as the relative inactivation in log units (log10[N0/Ni]; N0 as the initial number of untreated cells and Ni as the number of residual cells counted after treatment). Bars having an asterisk are statistically different (p < 0.05) from the untreated control according to the Student’s t-test. The detection limit is 10 CFU/ml.

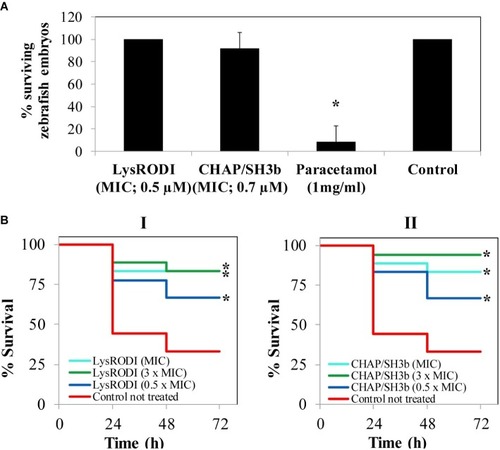
Evaluation of safety and activity of LysRODI and CHAPSH3b using a zebrafish model. (A) Acute toxicity of the proteins was tested by exposure of zebrafish embryos (n = 8) to 1 × MIC of LysRODI or CHAPSH3b. Medium E3 was used as a negative control and 1 mg/ml paracetamol, as a positive control. Bars represent mean ± standard deviation (n = 24) of triplicate experiments. The asterisk indicates statistical differences (p < 0.05) vs untreated control by Chi-square test. (B) Efficacy of LysRODI (I) and CHAPSH3b (II) in a zebrafish model infected with ~105 CFU/fish of S. aureus when treating with 0.5 × MIC, 1 × MIC and 3 × MIC. Kaplan–Meier graphs represent the percentage of cumulative survival zebrafish (n = 18) observed at 24, 48 and 72 h. Asterisks indicate significant differences (p < 0.05) vs. the untreated control according to the Kaplan–Meier cumulative survival plot and statistically compared by the Log-Rank test.

Efficacy of LysRODI preventive treatment in a mastitis mouse model. CD1 lactating mice at breastfeeding day 10 were treated by intramammary administration of 24 μg of LysRODI and challenged 90 min later with 5 × 10⁴ CFU/mice of S. epidermidis or S. aureus. Mice inoculated with PBS or mock buffer were used as controls of staphylococcal infection. (A) Macroscopic aspect of R4-R5 mammary glands of mice treated with (I) treated 24 μg/mouse of LysRODI or (II) PBS and infected with S. aureus Sa10. Red arrows indicate symptoms of edema, hyperemia and changes in color of an infected mammary gland. (B) Preventive efficacy of LysRODI against S. aureus and S. epidermidis mammary glands infections in CD1 mice, determined by the mean ± standard deviation of individual log10 CFU/mammary gland. White symbols are Lys-RODI treated mice; black symbols are untreated mice, inoculated with either PBS or mock sterile buffers; circles and squares represent, respectively, S. aureus and S. epidermidis challenged mice. The number of CFU was determined in each R4-R5 mammary gland, at 18 h post-challenge. Statistical comparison of means was performed by ANOVA and post-hoc PLSD tests: **p < 0.001 and ***p < 0.0001 vs. control (PBS or mock).

Acknowledgments
This image is the copyrighted work of the attributed author or publisher, and ZFIN has permission only to display this image to its users. Additional permissions should be obtained from the applicable author or publisher of the image. Full text @ Front Microbiol