
- Title
-
Duplication and subfunctionalisation of the general transcription factor IIIA (gtf3a) gene in teleost genomes, with ovarian specific transcription of gtf3ab
- Authors
- Rojo-Bartolomé, I., Santana de Souza, J.E., Diaz de Cerio, O., Cancio, I.
- Source
- Full text @ PLoS One
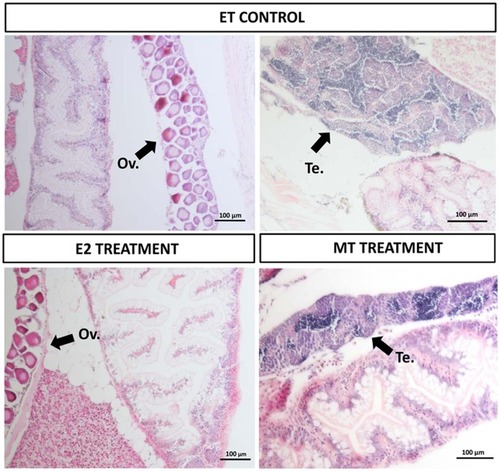
Histological analysis of hormone treated zebrafish at day 61. Micrographs (scale bars = 100 μm) are representative of 10 individuals analysed for each experimental group. ET: ethanol control group (6 females with well formed ovaries and 4 males with testis), E: 17β-estradiol treatment (100% of the individuals with ovary) and MT: 17α-methyltestosterone treatment (100% of the individuals with testis). Black arrows mark the presence of well differentiated gonad (ovaries in the two micrographs in the left and testes in the right). PHENOTYPE:
|

ZFIN is incorporating published figure images and captions as part of an ongoing project. Figures from some publications have not yet been curated, or are not available for display because of copyright restrictions. |