
IMAGE
Fig 4
- ID
- ZDB-IMAGE-200206-15
- Publication
- Rojo-Bartolomé et al., 2020 - Duplication and subfunctionalisation of the general transcription factor IIIA (gtf3a) gene in teleost genomes, with ovarian specific transcription of gtf3ab
- All Figures
- Figures for Rojo-Bartolomé et al., 2020
Image
|
Figure Caption
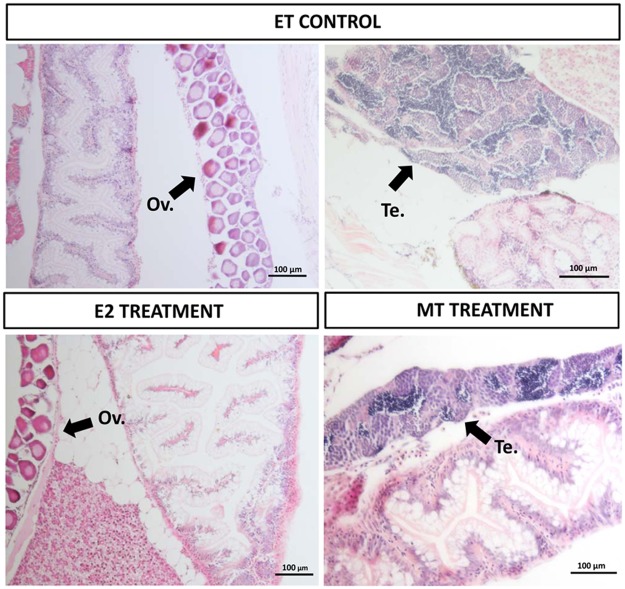
Fig 4
Histological analysis of hormone treated zebrafish at day 61.
Micrographs (scale bars = 100 μm) are representative of 10 individuals analysed for each experimental group. ET: ethanol control group (6 females with well formed ovaries and 4 males with testis), E: 17β-estradiol treatment (100% of the individuals with ovary) and MT: 17α-methyltestosterone treatment (100% of the individuals with testis). Black arrows mark the presence of well differentiated gonad (ovaries in the two micrographs in the left and testes in the right).
Figure Data
Acknowledgments
This image is the copyrighted work of the attributed author or publisher, and
ZFIN has permission only to display this image to its users.
Additional permissions should be obtained from the applicable author or publisher of the image.
Full text @ PLoS One