FIGURE SUMMARY
Title

Structural basis for adhesion G protein-coupled receptor Gpr126 function

Authors
Leon, K., Cunningham, R.L., Riback, J.A., Feldman, E., Li, J., Sosnick, T.R., Zhao, M., Monk, K.R., AraƧ, D.
Source
Full text @ Nat. Commun.

Crystal structure of the full extracellular region of Gpr126.

a Domain organization of Gpr126, indicating the ECR and 7TM regions. The unknown region includes a splice site. Cleavage sites (furin cleavage, autoproteolysis) are indicated by dashed lines. Domains are colored dark blue (CUB), cyan (PTX), gray (unknown region), yellow (HormR), red (GAIN), and purple (7TM). Domain boundaries are indicated below. SP indicates signal peptide. b Structure of the full ECR of (−ss) Gpr126. Domains are colored as in a except for the newly identified SEA domain (green). Domains are numbered (1–5) from N to C-terminus. Calcium ion in CUB domain is indicated as a green sphere. Dashed lines represent disordered residues. N-linked glycans are shown as green sticks. c Schematic of full-length Gpr126. The previously unknown region (SEA domain and linker region) is labeled. Autoproteolysis in GAIN domain is indicated by an asterisk and the last beta-strand of the GAIN domain is colored gray. d Representative negative-stain EM 2D class average of Gpr126 (−ss) ECR. Scale bar (white) represents 50 Å. Domains are assigned and colored according to color scheme noted above. The dashed line represents the linker region.

Closed conformation of Gpr126 is mediated by CUB-HormR-linker interactions.

a Structure of the full ECR of (−ss) Gpr126. b Close-up view of the CUB-HormR interface. Resides at the interface are shown as sticks. The calcium ion is shown as a bright green sphere. c Close-up view of the calcium-coordination site within CUB domain. The water molecule is shown as a blue sphere. The residues are shown as sticks. CUB residues are colored dark blue and HormR residue is colored yellow. Residue labels are colored according to their roles in CUB-HormR interaction: red (E89, D97, D134) represents calcium coordination by side-chain residue, blue (S136, V137) represents calcium coordination by main-chain carbonyl group, purple (F135) represents a hydrophobic residue in CUB-HormR interface, and orange (Y61) represents a residue that stabilizes calcium-coordinating residue D97. Calcium coordination is shown as bright green dashed lines. CUB-HormR interaction is shown as yellow dashed lines. The interaction between Y61 and D97 is shown as a magenta dashed line. d Sequence alignment of partial Gpr126 CUB domain from various species, highlighting important conserved residues: calcium-coordinating residues by side-chain group (red), calcium-coordinating residues by main-chain carbonyl (blue), a tyrosine residue that stabilizes a calcium-coordinating residue (orange), and a hydrophobic phenylalanine residue in the CUB-HormR interface (purple). e Close-up view of the disulfide-stabilized loop inserted between CUB and HormR domains. The disulfide bond is colored bright orange and is indicated by an arrow. The dashed line represents disordered residues in the linker region.

Alternative splice isoforms of Gpr126 modulate ECR conformation.

a Schematic diagram of Gpr126 splice isoforms generated by including (+ss) or excluding (−ss) exon 6. Residues encoded by exon 6 are colored magenta. Gray asterisks indicate potential O-linked glycosylation sites and the black asterisk indicates a predicted N-linked glycosylation site. The conserved disulfide bond in the linker is colored yellow. b, c Negative-stain EM 2D class averages for −ss (b) and +ss (c) ECR constructs. Class averages are categorized according to similar orientations: (i, ii, iii, iv, v, and vi). (i, ii, iii, iv) are observed in both –ss and +ss isoforms. (vi) represents open-like conformations (>50° angle) that are observed only in the +ss isoform. (v) represents unidentifiable miscellaneous views. Scale bars (white) represent 50 Å. d Quantification of percentage of particles per category for both isoforms. e Representative individual particles for both isoforms. Yellow arrows point to particles which are not in a closed conformation. f ECR conformations based on negative-stain EM are depicted as cartoons. The splice site is shown in magenta. Black arrows with dashed lines indicate dynamic ECR conformation.

Alternative splice isoforms of Gpr126 modulate receptor signaling.

a Cell-surface expression levels for empty vector (EV), zebrafish Gpr126 splice isoforms, measured using flow cytometry to detect binding of anti-FLAG antibody to cells expressing FLAG-tagged Gpr126. The Gpr126 cell-surface expression levels are normalized to the control EV signal. Data are shown as MFI (mean fluorescence intensity). Error bars are not shown because expression levels are presented as median fluorescence intensities of 10,000 cells for each population of transfected cells, for a single flow cytometry experiment representative of at least three independent experiments. b Basal signaling measured by the cAMP signaling assay. Data are shown as fold increase over EV of RLU (relative luminescence units). c Basal cAMP signaling normalized to cell-surface expression. ns, P > 0.05; *P ≤ 0.05; **P ≤ 0.01; ***P ≤ 0.001; ****P ≤ 0.0001; by one-way ANOVA and Tukey’s multiple comparisons test. Data in b and c are presented as mean ± SEM, n = 3, and are representative of at least three independent experiments. df Same as ac but for human GPR126 splice isoforms. Source data are provided as a Source Data file.

The calcium-binding site is required for Gpr126 function in vivo.

a Surface conservation analysis (green, variable; purple, conserved) of CUB domain. The calcium-binding site is circled in magenta. D134 and F135 are indicated by arrows. b D134 and F135 were both mutated to alanines through homologous recombination of a 150 bp ssODN containing a 5 bp mutation (red nucleotides). c Genotyping assay for the gpr126stl464 lesion. The 5 bp mutation introduces a BstUI restriction enzyme binding site. d 4 dpf wild-type larva compared to e 4 dpf gpr126stl464/stl464 larva with puffy ears (arrowheads). Scale bars (black) represent 100 μm. f 4 dpf wild-type larvae express mbp throughout the posterior lateral line nerve (PLLn, arrowhead), whereas g 4 dpf gpr126stl464/stl464 larva lack mbp expression along the PLLn (arrowhead). Scale bars (black) represent 100 μm. Asterisks indicate CNS.

Identification of a proteolytic SEA domain in human GPR126.

a Crystal structure of the SEA domain from zebrafish Gpr126. b (left) NMR structure of Mucin-1 SEA domain (PDB: 2ACM) and (right) Gpr126 SEA domain superimposed over Mucin-1 SEA domain. The loop containing the autoproteolysis site in Mucin-1 is indicated by a yellow arrow. The root-mean-square deviation (RMSD) of atoms between overlaid structures is 2.761 Å. c (left) Crystal structure of the Notch2 SEA domain (PDB: 2OO4) and (right) Gpr126 SEA domain superimposed over Notch2 SEA domain. The loop containing the furin-cleavage site (deleted in crystal structure construct) is indicated by an orange arrow. The RMSD of atoms between overlaid structures is 4.767 Å. d Sequence alignment of partial SEA domain from human Mucin-1, human Notch2, human GPR126, and zebrafish Gpr126. e Homology model of human GPR126 SEA model generated using SWISSMODEL. The arrow points to modelled furin-cleavage site. f Protein topology map of SEA domain. Furin-cleavage site is indicated by red scissors. Residues N-terminal to cleavage site are dark blue and residues C-terminal to cleavage site are light blue. Dashed lines represent backbone hydrogen bonds between beta sheets.

Model for ECR-dependent functions of Gpr126.

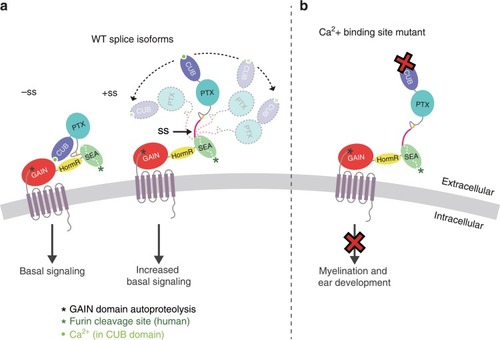
The model depicts how Gpr126/GPR126 function is regulated by its ECR. a Alternative splicing acts as a molecular switch to adopt different ECR conformations and have different basal levels of signaling. Gpr126 ECR that lacks the splice insert adopts a closed conformation and has basal activity, whereas Gpr126 ECR that includes the splice insert (magenta) is more dynamic and open-like, and has enhanced basal activity. Autoproteolysis in GAIN domain is indicated by a black asterisk. The calcium ion is shown as a bright green circle. b Mutation of conserved residues within the calcium-binding site leads to defects in both myelination and ear development in vivo. Human GPR126 function may also be regulated by furin cleavage, indicated by a green asterisk.

ZFIN is incorporating published figure images and captions as part of an ongoing project. Figures from some publications have not yet been curated, or are not available for display because of copyright restrictions.

PHENOTYPE:
Fish:
Observed In:
Stage: Day 4
Acknowledgments
This image is the copyrighted work of the attributed author or publisher, and ZFIN has permission only to display this image to its users. Additional permissions should be obtained from the applicable author or publisher of the image. Full text @ Nat. Commun.