FIGURE SUMMARY
Title

A systems biology approach reveals neuronal and muscle developmental defects after chronic exposure to ionising radiation in zebrafish

Authors
Murat El Houdigui, S., Adam-Guillermin, C., Loro, G., Arcanjo, C., Frelon, S., Floriani, M., Dubourg, N., Baudelet, E., Audebert, S., Camoin, L., Armant, O.
Source
Full text @ Sci. Rep.

(a) Experimental design and dosimetry. The cumulative dose in Gy are indicated for each developmental stages and sampling time (in red). (b) Detection of γ-H2AX foci in 24 hpf and 48 hpf embryos by whole-mount immunocytochemistry. Standard-error to the mean is indicated for each exposure (Kruskall-wallis test followed by a pairwise Wilcoxon rank sum post-hoc test and adjusted by the Holm method, adjusted p-value: * < 0.05). (c) Examples of positive γ-H2AX foci (green, white arrows) detected in DAPI stained nucleus (blue) by confocal microscopy. (d) Means of body length measured at 48 hpf (in mm) are indicated as white lozenge. Dots represent individual data.

(a) Box-plot of cardiac activity shown as heart beats per minute in 48 hpf larvae. Dots represent individual data. Means are indicated as white lozenge (Kruskall-wallis test followed by a pairwise Wilcoxon rank sum post-hoc test and adjusted by the Holm method, adjusted p-value: * < 0.05). (b) Box-plot of embryonic burst activity at 24 hpf. Means are indicated as white lozenge (significance of permutation test p-value: * < 0.05). (c) Box-plot of larval motility with the visual motor response test 120 hpf followed over three consecutive light cycles of 5 min (indicated at the top). The mean distance travelled by larvae is indicated as white lozenge. Results of a permutation test are indicated (* p-value < 0.05).

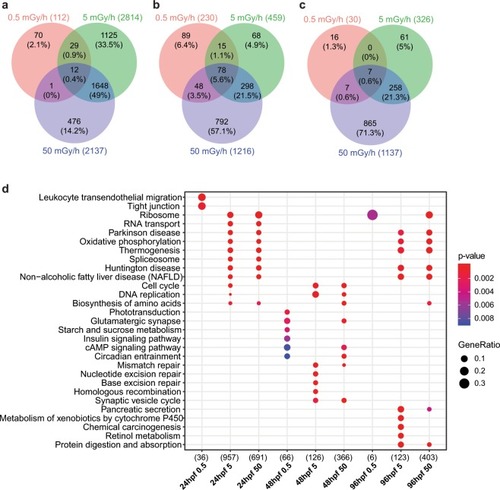
Venn diagram of differentially expressed genes at the three dose rates (|fold change| ≥ 1.5 and adjusted p-value < 0.01), at (a) 24 hpf, (b) 48 hpf and (c) 96 hpf. The number of up or down-regulated genes are indicated in brackets. (d) Dot plot of KEGG enrichment with human orthology showing the top-enriched pathways. The total numbers of deregulated genes within the KEGG pathways selected on the dot plot are indicated in brackets. Colours indicate the enrichment p-values from exact Fisher’s test, and dots size is proportional to the number of genes constituting the given pathway.

(a) Number of transcription factors (TF) with significant deregulation (|fold change| ≥ 1.5 and adjusted p-value < 0.01) over developmental time at three different dose rates. (b) Hierarchical clustering of 462 TF misregulated in at least one comparative analysis. Blue indicate downregulation, white no change and red upregulation, as compared to control conditions. Clusters of co-regulated genes are indicated at the right from 1 to 6. (c) GO enrichment of TF classified in 6 different clusters. Cluster number are indicated below, the total number of deregulated TF in each GO term in brackets. (d) Expression patterns (as normalised count) of key master regulators during development using loess smoothed conditional means. Cluster numbers are indicated at the top. *|fold change| ≥ 1.5 and adjusted p-value < 0.01.

(a) Transcription factor binding sites enrichment in the promoters of upregulated genes, and (b) in downregulated genes at 24 hpf, 48 hpf and 96 hpf, after exposure to 50 mGy/h. Top 5 enriched transcription factor binding sites are indicated in red, and other binding sites of interest, near the limit of significance, in blue. Master regulators involved in neurogenesis, myogenesis, synaptogenesis and RA pathways are highlighted in bold.

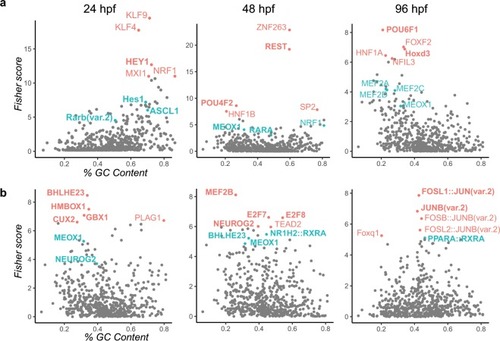
Volcano plots of deregulated proteins in 96 hpf larvae exposed (
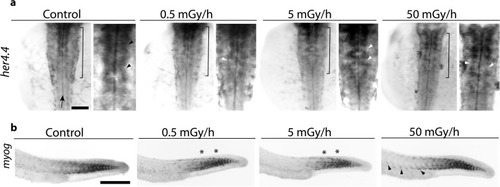
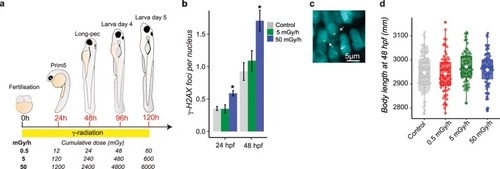
a) at 5 mGy/h and (b) at 50 mGy/h. Proteins with significant expression change (|fold change| ≥ 1.5 and p-value < 0.01) after IR exposure are highlighted in red. (c) Heatmap of GO terms enriched in the proteomics data. Significant p-values (Fisher’s exact test) are in blue (< 0.01) and non-significant p-value in white.

Whole mount RNA in situ hybridization on 24 hpf embryos. (a) Dorsal view of embryos oriented with anterior (head) towards to the top. Right pictures are higher magnifications of area indicated in the rhombencephalon by the black brackets. Black arrow indicates the position of the central canal. Black arrow heads indicate the position of her4.4 positive neuronal progenitors flanking the central in control embryos and white arrow heads missing progenitors in exposed embryos. (b) Lateral view of 24 hpf embryos labelled with myog, anterior to the left. The black arrow heads indicate ectopic expression of myog in somites located in the anterior part of the trunk at 50 mGy/h. * Indicates the position of mis-shaped somites in the trunk. Scale bares: 200 µm.

(a) Transmission electron microscopy of muscles in 96 hpf larvae. A and Z bands of sarcomeres are indicated. * Indicates altered myofibers. Arrows indicate the triads constituted of t-tubes and the two flanking cisterna of the sarcoplasmic reticulum (black: normal, white: deformed). Scale bares: 1 µm. (b) Categorization and quantification of myofiber damage. The percentage of TEM images defined as ROI (region of interest) displaying normal or damaged (moderate or extensive) myofibers was computed from at least 21 independent ROI in triplicate (n > 71 for each group).

Acknowledgments
This image is the copyrighted work of the attributed author or publisher, and ZFIN has permission only to display this image to its users. Additional permissions should be obtained from the applicable author or publisher of the image. Full text @ Sci. Rep.