FIGURE SUMMARY
Title

Macrophages in Zebrafish Models of Liver Diseases

Authors
Shwartz, A., Goessling, W., Yin, C.
Source
Full text @ Front Immunol

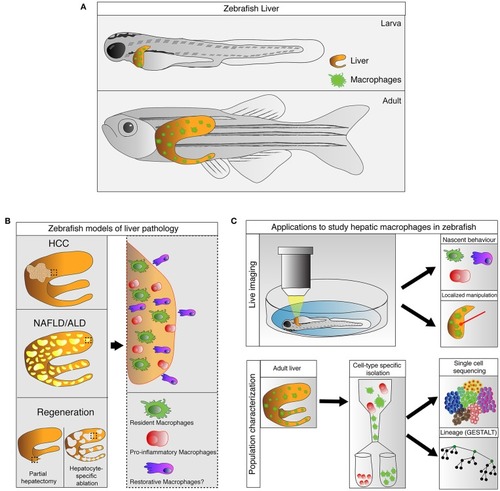
Zebrafish, an emerging model for study hepatic macrophages. (A) Hepatic macrophages are present in the zebrafish liver at both larval and adult stages. (B) Increases in macrophage numbers have been observed in zebrafish models of liver pathology include non-alcoholic liver disease (NAFLD), alcoholic liver disease (ALD), and hepatocellular carcinoma (HCC), as well as in liver regeneration after partial hepatectomy and hepatocyte-specific ablation (left). Involvement of heterogeneous macrophage populations has been implicated in these models (right). (C) Current and potential applications available in zebrafish to study hepatic macrophages. Zebrafish larva is accessible for live imaging, allowing characterization of macrophage behaviors during early stages of immune responses. The live imaging platform in larva can also be utilized for laser-mediated localized manipulations of gene expression and cell ablation. Technologies such as GESTALT (genome editing of synthetic target arrays for lineage tracing) and single cell RNA-sequencing can be utilized to study the ontology and plasticity of macrophages in healthy and injured livers at a population level.

Acute ethanol treatment causes hepatic steatosis and increases macrophage numbers in larval zebrafish. (A,B) Hematoxylin and eosin (H&E) staining of the paraffin sections showing the livers in a control larva (A) and a larva treated with 2% ethanol from 96 to 120 h post fertilization (B). The livers were harvested at 27 h post treatment (hpt). Scale bar, 20 μm. (C,D) Representative images of the whole-mount Oil Red O staining in the control (C) and ethanol-treated larvae (D). Dashed line outlines the liver. Lateral view, anterior is to the top. Oil Red O also stains the swim bladder (asterisk in C) and the residual yolk tissue (asterisk in D). Scale bar, 250 μm. (E,F) Confocal three-dimensional projections showing Tg(mpeg1:YFP)-expressing macrophages (green) in the whole liver at 27 hpt. Phalloidin staining (red) that labels cell cortex is used for recognizing various organs. Ventral views, anterior is to the top. Dashed line outlines the liver. Scale bar, 30 μm. (G) Numbers (mean±s.e.m.) of macrophages per liver at 0 hpt (left) and 27 hpt (right). Statistical significance was calculated by one-way ANOVA and Tukey's post-hoc test. **p < 0.01, ns, not significant. This figure is reproduced with permission from Zhang et al. (73) and Disease Models & Mechanisms.

Acknowledgments
This image is the copyrighted work of the attributed author or publisher, and ZFIN has permission only to display this image to its users. Additional permissions should be obtained from the applicable author or publisher of the image. Full text @ Front Immunol