
- Title
-
Copper Regulates the Susceptibility of Zebrafish Larvae to Inflammatory Stimuli by Controlling Neutrophil/Macrophage Survival
- Authors
- Chen, M., Luo, Y., Xu, J., Chang, M.X., Liu, J.X.
- Source
- Full text @ Front Immunol
|
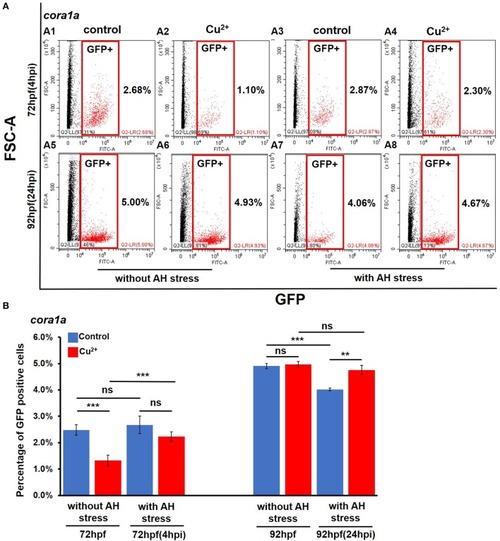
Percentages of |
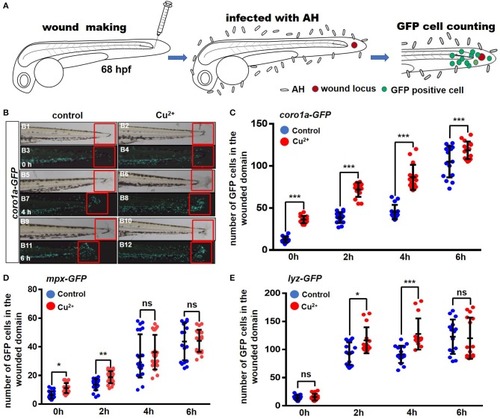
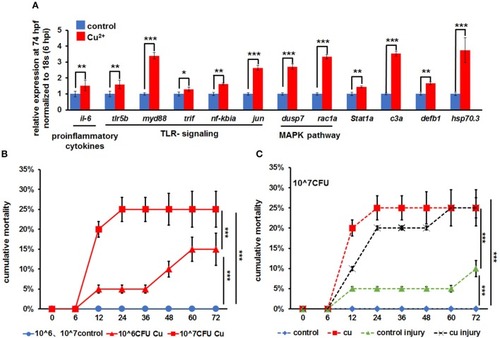
Copper-stressed macrophages and neutrophils respond more quickly to |
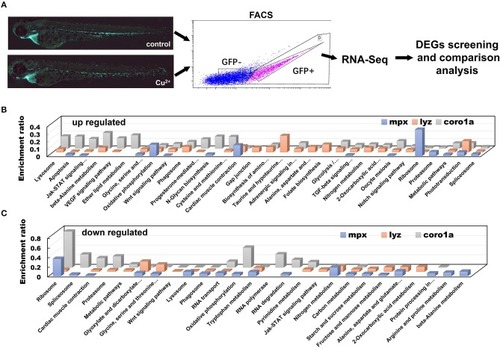
DEGs in copper-stressed |
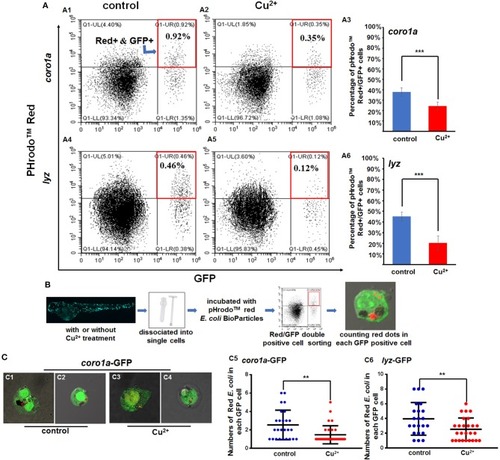
Phagocytosis of macrophages and neutrophils in copper-stressed and control larvae. |
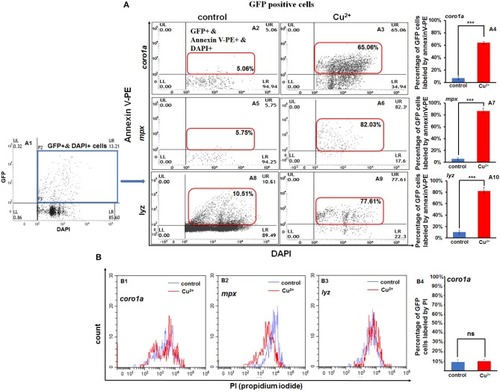
Increased apoptosis of macrophages and neutrophils in copper-stressed larvae. Annexin-V [ |
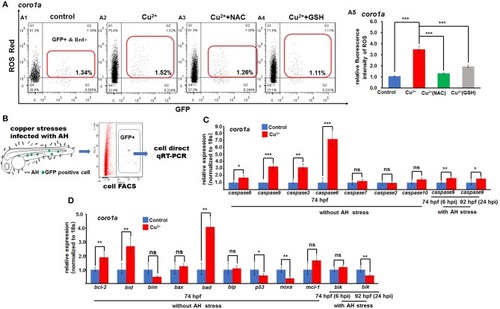
ROS- and mitochondrial ROS (mROS)-mediated apoptosis signaling in copper-stressed macrophages and neutrophils. ROS red labeling [ |
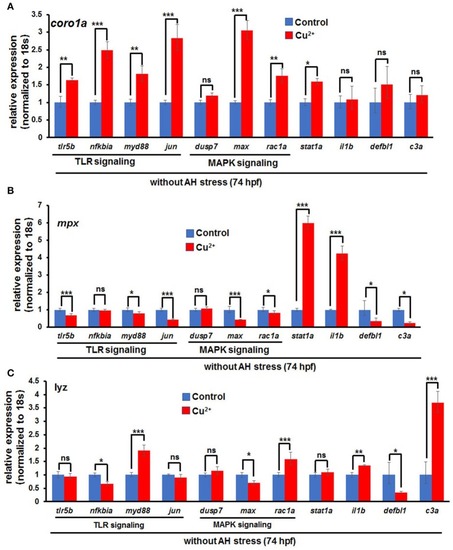
Expression of immune-related genes in copper-stressed macrophages and neutrophils under no |
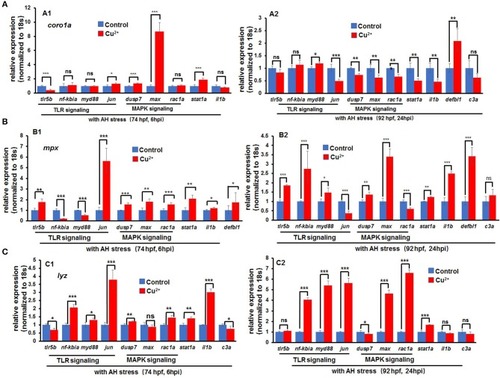
Expression of immune-related genes in copper-stressed macrophages and neutrophils after |