IMAGE

Figure 5

ID
ZDB-IMAGE-191230-1358
Source
Figures for Chen et al., 2019
Image
Figure Caption

Figure 5

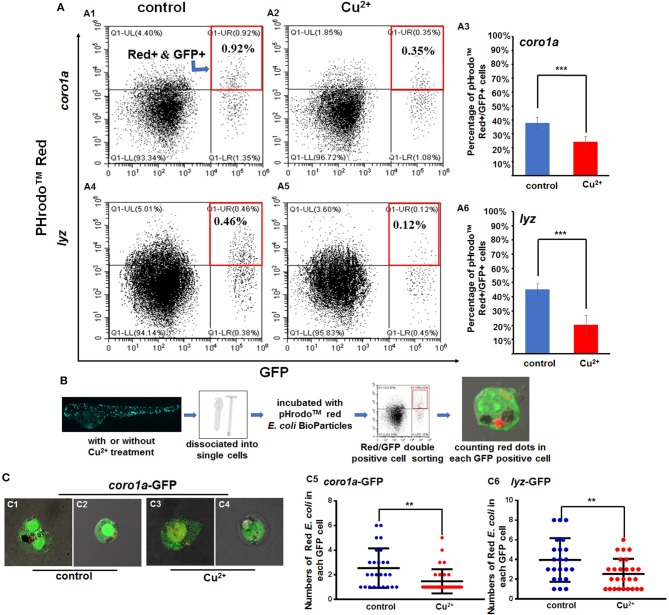
Phagocytosis of macrophages and neutrophils in copper-stressed and control larvae. (A) FACS plots (A1,A2,A4,A5) and percentages of red E. coli-positive cells in the total coro1a promotor-driven GFP-positive macrophage and neutrophil cells (A3) and in the total lyz promotor-driven GFP-positive neutrophil cells (A6), respectively, following copper stimulation, red boxes indicating GFP and red positive cells by FACS. (B) Schematic view of E. coli phagocytosis activity tests for macrophages or neutrophils in copper-stressed or control larvae. (C) Mean (±SD) number of red E. coli cells per macrophage or neutrophil in the no-copper-stressed control or copper-stressed larvae. Macrophage with phagocytic red E. coli(C1,C3) or neutrophil cells (C2,C4) from the control (C1,C2) and copper-stressed larvae (C3,C4), and mean (±SD) number of red E. coli cells per macrophage or neutrophil in coro1a-GFP cells (C5) or lyz-GFP cells (C6) was calculated. Two biological replicates were performed. Analysis with hypergeometric distribution in R-console software for bi-modal distribution to exhibit individual variations in each group in one experiment. ***P < 0.001; **P < 0.01.

Acknowledgments
This image is the copyrighted work of the attributed author or publisher, and ZFIN has permission only to display this image to its users. Additional permissions should be obtained from the applicable author or publisher of the image. Full text @ Front Immunol