
- Title
-
Lysophosphatidic acid receptor LPA3 prevents oxidative stress and cellular senescence in Hutchinson-Gilford progeria syndrome
- Authors
- Chen, W.M., Chiang, J.C., Lin, Y.C., Lin, Y.N., Chuang, P.Y., Chang, Y.C., Chen, C.C., Wu, K.Y., Hsieh, J.C., Chen, S.K., Huang, W.P., Chen, B.P.C., Lee, H.
- Source
- Full text @ Aging Cell
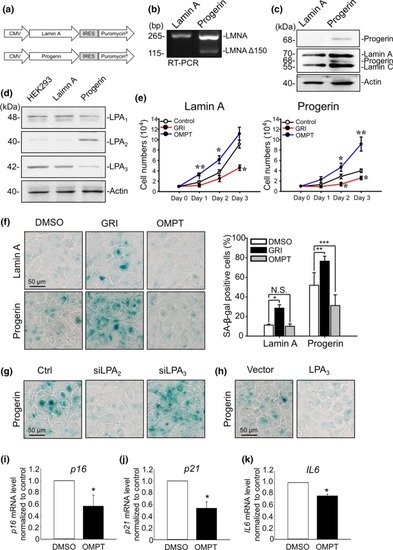
LPA2 upregulation and LPA3 downregulation correlate with attenuated cell proliferation and increased senescence in Progerin HEK293 cells. (a) Design of vectors expressing Lamin A and Progerin. Puromycin was applied as the selection marker to establish Progerin HEK293 stable cells. (b) PCR with primer targeting outside of the cryptic splicing site shows alternate 150‐nucleotide splicing of Lamin A mRNA in Progerin HEK293 cells. (c) Western blot with anti‐Lamin A/C (ab108595) and anti‐Progerin (sc‐81611) antibody shows expression of Progerin in Progerin HEK293 cells (d) Western blot with LPA receptor antibodies shows upregulation of LPA2 and downregulation of LPA3 in Progerin HEK293 cells. Actin was used as a loading control. (e) Cell number measurements show that, in both Lamin A and Progerin HEK293 cells, activating LPA2 with 5 μM of GRI decreased the cell proliferation rate, but activating LPA3 with 100 nM of OMPT increased the cell proliferation rate. (f) Representative images of senescence‐associated β‐gal staining assay and its quantified results. Treating Lamin A and Progerin HEK293 cells with 5 μM of GRI for 4 days increased the percentage of β‐gal‐positive cells in both cell lines. Treating Progerin HEK293 cells with 100 nM OMPT for 4 days reduced the percentage of β‐gal‐positive cells. (g) Knockdown of LPA2 by siRNA (siLPA2) reduced β‐gal‐positive Progerin HEK293 cells. Knockdown of LPA3 by siRNA (siLPA3) increased β‐gal‐positive cells. (h) Overexpression of LPA3 decreased β‐gal‐positive cells. (i) Real‐time qPCR showed that treatment of 100 nM OMPT for 24 hr reduced mRNA level of |
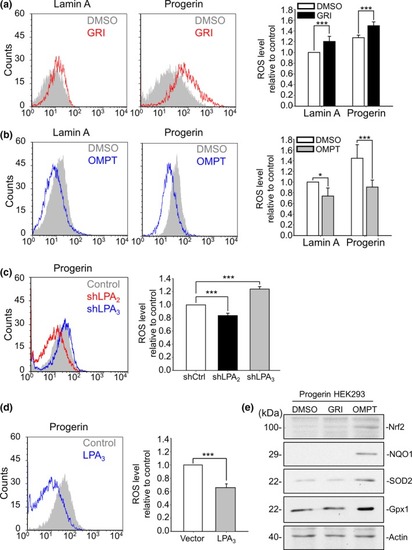
LPA2 increases, but LPA3 suppresses ROS buildup in Progerin HEK293 cells. (a) By flow cytometry, CM‐DCFDA staining results show that activating LPA2 by 5 μM GRI for 24 hr increased ROS levels in both Lamin A and Progerin HEK293 cells. (b) Activating LPA3 by 100 nM OMPT for 24 hr decreased ROS levels in both Lamin A and Progerin HEK293 cells (c) Knockdown of LPA2 by shRNA (shLPA2) reduced ROS levels, but knockdown of LPA3 by shRNA (shLPA3) increased ROS levels in Progerin HEK293 cells. (d) Overexpression of LPA3 reduced ROS levels in Progerin HEK293 cells. (e) After 48 hr of 5 μM GRI and 100 nM OMPT, Western blot results showed that activation of LPA3, but not LPA2, induced expression of the antioxidant mediators Nrf2, NQO1, SOD2, and Gpx1 in Progerin HEK293 cells. Actin was used as the loading control. ANOVA and Student's |
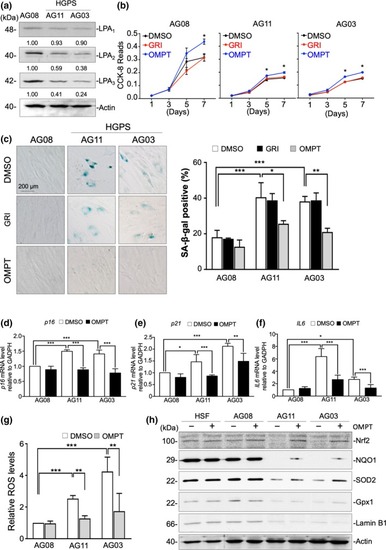
LPA3 reduction accelerates cell senescence in HGPS patient fibroblasts. (a) Western blot results show lower LPA2 and LPA3 protein levels in HGPS patient fibroblasts (AG11 and AG03) than in normal fibroblasts (AG08). (b) CCK‐8 assay revealed that activating LPA3 with 100 nM OMPT for 5 and 7 days rescued cell proliferation of HGPS AG11 and AG03 fibroblasts after. However, activating LPA2 with 5 μM GRI had no effect on cell proliferation. (c) Representative images of senescence‐associated β‐gal staining assay and its quantified results. Treating with 100 nM OMPT for 7 days reduced the percentage of β‐gal‐positive HGPS AG03 and AG11 fibroblasts. However, activating LPA2 with 5 μM GRI had no effect on cell senescence. (d) Real‐time qPCR showed that treatment of 100 nM OMPT for 24 hr reduced mRNA level of |
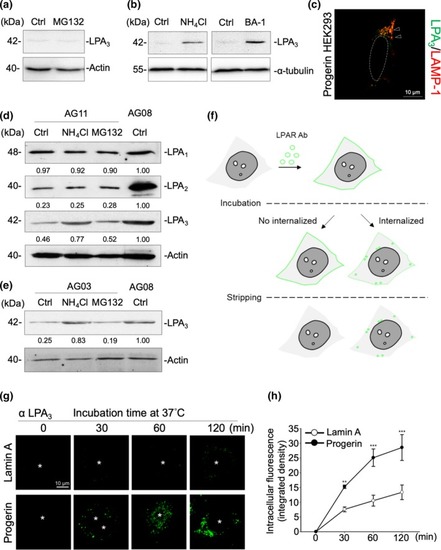
LPA3 is highly internalized and sorted to the lysosome degradation pathway in Progerin cells. (a) Western blot results show that treating Progerin HEK293 cells with 5 μM of MG132 for 6 hr showed no LPA3 protein restoration. DMSO was used as solvent control (Ctrl). (b) Western blot results show that Progerin HEK293 cells were treated with 5 mM of NH4Cl or 20 nM of Bafilomycin A1 (BA‐1) for 6 hr to block LPA3 degradation through the lysosome pathway. ddH2O was used as solvent control for NH4Cl (Ctrl in upper panel). DMSO was used as solvent control for BA‐1 (Ctrl in lower panel). (c) Western blot results show that HGPS AG11 fibroblasts were treated with 5 mM of NH4Cl and 5 μM of MG132 for 6 hr. NH4Cl treatment rescued LPA3, but not LPA1 or LPA2, in HGPS AG11 fibroblasts. ddH2O and DMSO were both loaded to control sample as solvent control (Ctrl). (d) Counter‐immunofluorescent staining by LPA3 and LAMP‐1 shows that LPA3 localized into the lysosomes in Progerin HEK293 cells. (e) Western blot results show that NH4Cl treatment rescued LPA3 in HGPS AG03 fibroblasts. ddH2O and DMSO were both loaded to control as solvent control (Ctrl). (f) Scheme representing the internalization assay of LPA receptors. (g) Representative images of time‐dependent LPA3 internalization. Internalization of LPA3 was higher in Progerin HEK293 cells. (h) Integrated density of intracellular fluorescence was quantified to indicate internalized LPA3. ANOVA and Student's |
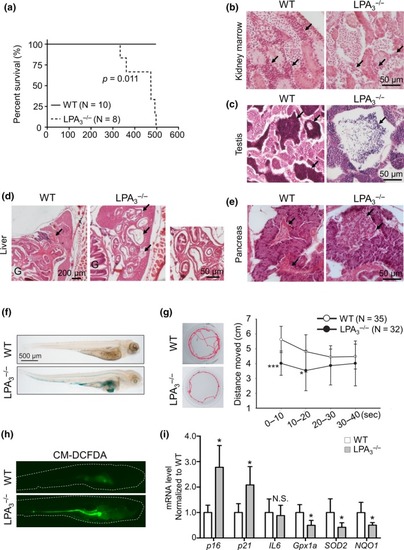
LPA3 deficiency in zebrafish leads to premature aging phenotypes. (a) Kaplan–Meier survival analysis demonstrated a shorter lifespan in |
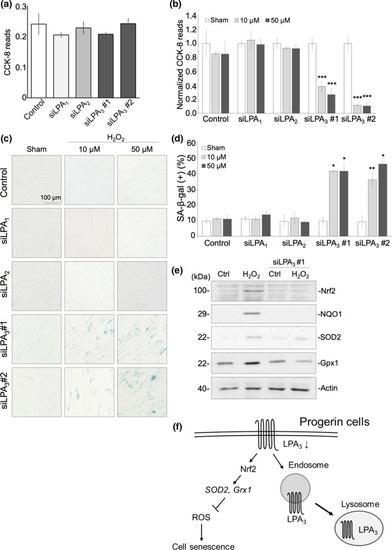
LPA3 protects fibroblasts against cell senescence caused by oxidative stress. (a) CCK‐8 assay showed that knockdown of LPA receptors alone had no effect on cell proliferation. (b) CCK‐8 revealed that treatment with 10 μM and 50 μM H2O2 for 3 days significantly decreased cell proliferation in knockdown of LPA3, but not of LPA1 or LPA2. CCK‐8 reads were normalized to a sham group. (c) Representative images of senescence‐associated β‐gal staining assay. Treatment with 10 μM and 50 μM H2O2 for 3 days significantly increased percentages of β‐gal + cells in knockdown of LPA3, but not of LPA1 or LPA2. Quantification was shown in (d). (e) Western blot showed that 100 μM of H2O2 treatment for 6 hr increased protein level of Nrf2, NQO1, SOD2, and Gpx1, whereas LPA3 knockdown abolished the effects. (f) Graphical abstract of this study. ANOVA and Student's |