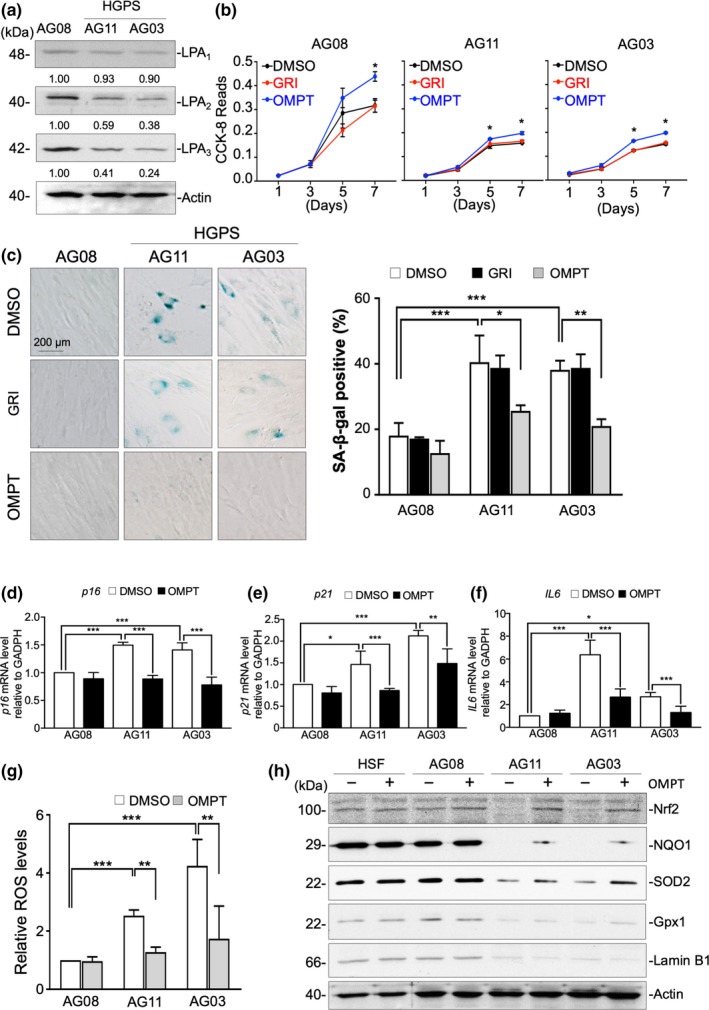
IMAGE

Figure 3

ID
ZDB-IMAGE-200130-17
Source
Figures for Chen et al., 2019
Image
Figure Caption

Figure 3

LPA3 reduction accelerates cell senescence in HGPS patient fibroblasts. (a) Western blot results show lower LPA2 and LPA3 protein levels in HGPS patient fibroblasts (AG11 and AG03) than in normal fibroblasts (AG08). (b) CCK‐8 assay revealed that activating LPA3 with 100 nM OMPT for 5 and 7 days rescued cell proliferation of HGPS AG11 and AG03 fibroblasts after. However, activating LPA2 with 5 μM GRI had no effect on cell proliferation. (c) Representative images of senescence‐associated β‐gal staining assay and its quantified results. Treating with 100 nM OMPT for 7 days reduced the percentage of β‐gal‐positive HGPS AG03 and AG11 fibroblasts. However, activating LPA2 with 5 μM GRI had no effect on cell senescence. (d) Real‐time qPCR showed that treatment of 100 nM OMPT for 24 hr reduced mRNA level of p16 in HGPS patient fibroblasts (AG11 and AG03). (e) 100 nM OMPT for 24 hr reduced mRNA level of p21. (f) 100 nM OMPT for 24 hr reduced mRNA level of IL6. GAPDH was used as internal control. (g) By flow cytometry, DCFDA staining results show that activating LPA3 by 100 nM OMPT for 48 hr decreased ROS levels in both HGPS AG03 and AG11 fibroblasts. However, activating LPA2 with 5 μM GRI had no effect on ROS level. (h) Western blot results show that activating LPA3 by 100 nM OMPT for 48 hr stabilized Nrf2 in HGPS AG11 fibroblasts and enhanced protein levels of NQO1, SOD2, and Gpx1, but not Lamin B1. Actin was used as a loading control. ANOVA and Student's t test; *p < .05, **p < .01, ***p < .001

Acknowledgments
This image is the copyrighted work of the attributed author or publisher, and ZFIN has permission only to display this image to its users. Additional permissions should be obtained from the applicable author or publisher of the image. Full text @ Aging Cell