
- Title
-
The minimal gap-junction network among melanophores and xanthophores required for stripe-pattern formation in zebrafish
- Authors
- Usui, Y., Aramaki, T., Kondo, S., Watanabe, M.
- Source
- Full text @ Development

Mutant and transgenic fish lines, and reconstructed gap junction networks. (A) Plasmid construct designs: mitfa promoter (A; upper line) and aox5 promoter (A; lower line) were used for pigment-cell-specific gene expression. tTA/TRE was used to enhance aox5 promoter activity, and an ubipro (ubiquitinb promoter)-EGFP cassette was used to simplify the genotyping of fish embryos. The fragments were cloned into a pTol2 plasmid, and each plasmid was used to generate transgenic zebrafish. (B-R) The reconstructed gap junction network (left) and a representative photograph of a fish from the corresponding line (right). Wild-type (B; WT), cx39.4−/− (C; luchs), cx41.8−/− (D; leopard) and double-knockout mutant (E; WKO), and transgenic zebrafish lines in WKO background (F-N; Tg-1 to Tg-9), cx39.4−/− background (O,P; Tg-10 and Tg-11) and cx41.8−/− background (Q,R; Tg-12 and Tg-13). mitfa promoter (F,G,O,Q) and aox5 promoter (H,I,P,R) were used to induce cx39.4 or cx41.8 in pigment cells. Double (K-N) and quadruple (J) transgenic lines were generated by means of crossing among mutant and transgenic lines. Gene expression in unexpected cells was monitored using IRES-H2BRFP fluorescent protein (Fig. S2). Scale bar: 10 mm. |
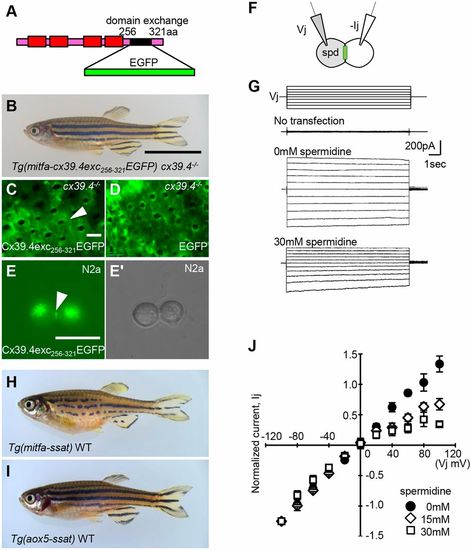
Visualization and characterization of Cx39.4. (A) Schematic of EGFP-tagged Cx39.4. Cx39.4 C-terminal sequence from amino acids 256 to 321 was exchanged with the EGFP fragment. (B) Cx39.4exc256-321EGFP was expressed in melanophores of cx39.4−/− mutant zebrafish. The mutant phenotype was restored to the stripe pattern after expression. (C) Fluorescence image of transgenic fish skin at F0 generation in cx39.4−/− mutant zebrafish; white arrowhead indicates gap junction plaque between melanophores. (D) Control: EGFP was expressed in melanophores of cx39.4−/− mutant zebrafish; no EGFP signal was detected between melanophores. (E,E′) Transfected N2a cells: fluorescence (E) and bright-field (E′) microscopy images; white arrowhead indicates a gap junction plaque. (F) Schematic of patch-clamp experiment with spermidine (spd) treatment. (G) Both N2a cells were clamped at −40 mV and a series of transjunctional voltages (Vi, −140 to +60 mV, 20 mV increment) was applied to one of the cells (first trace), and transjunctional current (Ij) was recorded in the other cell with or without spermidine treatment (third and fourth traces). As a negative control, untransfected cells were used (second trace). (H,I) The polyamine metabolic enzyme Ssat (Sat1b) was ectopically expressed in melanophores (H) and xanthophores (I). (J) I-V plot showing the relationship between normalized steady-state junctional currents and transjunctional voltages for 0 mM, 15 mM and 30 mM spermidine treatment. Each data point represents the mean±s.d. for each Vj value (n=5). Vj=Vpre–Vpost (−40 mV). Scale bars: 10 mm in B,H,I; 100 µm in C,D; 20 µm in E,E′. |