FIGURE SUMMARY
Title

Otoferlin Depletion Results in Abnormal Synaptic Ribbons and Altered Intracellular Calcium Levels in Zebrafish

Authors
Manchanda, A., Chatterjee, P., Bonventre, J.A., Haggard, D.E., Kindt, K.S., Tanguay, R.L., Johnson, C.P.
Source
Full text @ Sci. Rep.

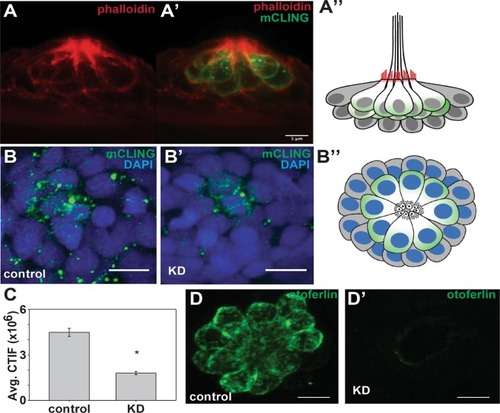
Depletion of otoferlin results in reduced hair cell vesicle recycling. (AA’) Representative confocal images of 96 hpf (A) phalloidin stained neuromasts and (A’) phalloidin and mCLING stained neuromast viewed laterally. (A”) A diagram of a neuromast viewed laterally, with phalloidin stained actin denoted in red, and mCLING loaded hair cells denoted in green. Support cells are depicted in grey. (BB”) Representative confocal images of control morpholino injected (B) and otoferlin morphant injected (B’) lateral line neuromasts labeled with DAPI (blue) and mCLING (green) of mCLING incubation at room temperature. (B”) A diagram of a neuromast in the same orientation as B, B’, with DAPI denoted in blue, and mCLING loaded hair cells denoted in green. Support cells are depicted in grey. (C). Quantification of average mCLING dye associated with neuromasts of negative control injected and morphant zebrafish (t-test, p < 0.001). N = 6 larvae, 3–6 neuromasts per larvae for both negative control and morphant. (DD’) Representative images of lateral line neuromasts stained for otoferlin (green) under (D) control injected and (D’) morpholino injected conditions. Scale bars = 5 µm.

EXPRESSION / LABELING:
Antibody:
Fish:
Knockdown Reagents:
Anatomical Term:
Stage: Day 4

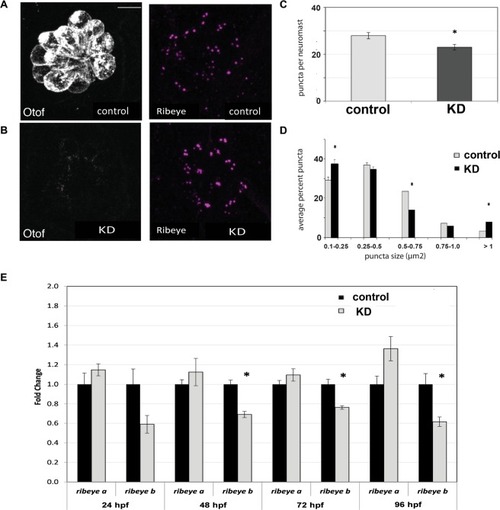
Effects of otoferlin depletion on synaptic morphology in posterior lateral line neuromasts of 96 hpf zebrafish larvae. (A,B) Representative confocal z-projection images of neuromasts from control injected (A) and otoferlin morphant (B) larvae immunolabeled with anti-otoferlin (HCS-1), and anti-Ribeye. (C) Average number of Ribeye puncta counted per neuromast in negative control injected (no. of neuromasts = 20) and morphant (no. of neuromasts = 18) larvae (t-test, p-value < 0.0001). Error bars indicate s.e.m. (D) Average percent of Ribeye puncta per neuromast that fell within size bins of 0.1–0.25, 0.25–0.5, 0.5–0.75, 0.75–1.0, and >1.0 µm2, in control injected (no. of neuromasts = 20) and morphant (no. of neuromasts = 18) larvae (t-test, p-value < 0.0001), Error bars indicate s.e.m. (E) Expression of ribeye transcripts in control and morphant larvae at 24, 48, 72, and 96 hpf, N = 4 per time point (t-test, p-value < 0.05). Scale bars = 5 µm.

EXPRESSION / LABELING:
Genes:
Fish:
Knockdown Reagents:
Anatomical Term:
Stage Range: Prim-5 to Day 4
PHENOTYPE:
Fish:
Knockdown Reagents:
Observed In:
Stage Range: Long-pec to Day 4

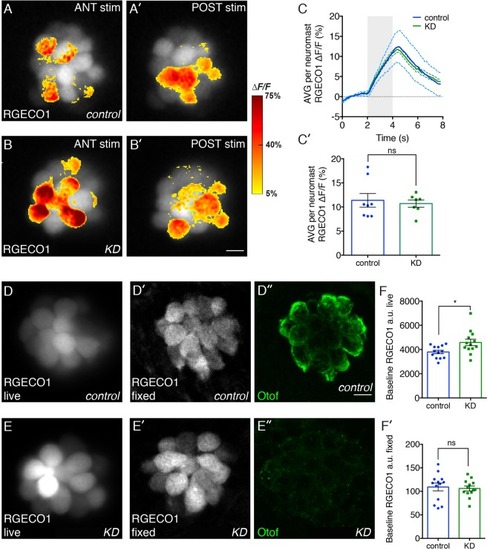
Effects of otoferlin depletion on intracellular calcium in posterior lateral line neuromasts. Representative evoked R-GECO1 calcium signals in negative control injected (AA’) and otoferlin depleted (BB’) neuromasts during mechanical stimulation of hair bundles. The ANT (anterior) and POST (posterior) responses reflect the two directions the posterior lateral-line neuromasts are mechanically sensitive. Calcium signals during stimulation (AA’ and BB’) are colorized according to the heat map and superimposed onto baseline images. (C,C’) The magnitude of the mechanically-evoked R-GECO1 calcium responses were not significantly altered between control and otoferlin depleted neuromasts, t-test p = 0.70, n = 8 control and 7 KD neuromasts. (D,E) The live, R-GECO-1 baseline intensity in otoferlin depleted hair cells was significantly elevated compared to controls (DF) t-test, p = 0.016. In the same samples as (F), the fixed, R-GECO1 levels (D’,E’) were not significantly different in otoferlin depleted hair cells compared to controls (F’), t-test, p = 0.745, n = 13 neuromasts. (D”,E”) Samples were also immunostained with HCS-1 (Otof) to ensure depletion was effective. Scale bars = 5 µm.

RNA sequencing and RT-qPCR for differentially expressed genes in otoferlin depleted larvae. (A) Black bar graphs represent relative mRNA expression changes of the upregulated and downregulated genes derived from transcriptomic analysis (no. of biological reps. =4, each replicate consists of 15 pooled embryos). Grey bars represent qRT-PCR data of mRNA expression changes of genes in larval otoferlin mutant zebrafish at 96 hpf (no. of biological reps. = 4, each replicate consists of 30 pooled embryos). Each gene is normalized with respect to the corresponding controls. qRT-PCR, ΔΔCt values were calculated by comparing ΔCt values (normalized to beta-actin) to the mean ΔCt for each gene. Data were analyzed by Wilcoxon’s test with standard 5% significance level. Abbreviations otof a: Otoferlin a, otof b: Otoferlin b, rtn4rl2a: Reticulon 4 Receptor like 2a, rtn4rl2b: Reticulon 4 Receptor like 2b, s100s: S100 Calcium Binding Protein S, pvalb9: Parvalbumin 9. (B) Rescue of repressed transcripts in otoferlin depleted larvae. Bar graphs represent relative mRNA expression changes of transcripts in otoferlin depleted larvae at 96 hpf (denoted otoAB KD, black bars) and rescue of the transcripts (denoted (m) otof, grey bars) in morphants coinjected with full length otoferlin rescue construct. Each gene is normalized with respect to the corresponding controls (white bars). ΔΔCt values were calculated by comparing ΔCt values (normalized to beta-actin) to the mean ΔCt for each gene. Data were analyzed by t-test. For pval9b and rtn4rl2b groups both otoferlin depleted and rescue samples showed statistically significant changes in expression compared to controls (p-value < 0.05). For rtn4rl2a significant repression in expression for the KD were found (p-value < 0.05), and there was restoration of repressed transcripts in the rescue larvae. (C) Expression of s100s, pval9b, rtn4rl2a, rtn4rl2b at 24, 48 and 72 hpf in control and otoferlin depleted zebrafish larvae (n = 4 p < 0.05). For (AC), error bars are s.e.m.

EXPRESSION / LABELING:
Genes:
Fish:
Knockdown Reagents:
Anatomical Term:
Stage Range: Prim-5 to Day 4
PHENOTYPE:
Fish:
Knockdown Reagents:
Observed In:
Stage Range: Prim-5 to Day 4
Acknowledgments
This image is the copyrighted work of the attributed author or publisher, and ZFIN has permission only to display this image to its users. Additional permissions should be obtained from the applicable author or publisher of the image. Full text @ Sci. Rep.