FIGURE SUMMARY
Title

Histone H3K27 acetylation precedes active transcription during zebrafish zygotic genome activation as revealed by live-cell analysis

Authors
Sato, Y., Hilbert, L., Oda, H., Wan, Y., Heddleston, J.M., Chew, T.L., Zaburdaev, V., Keller, P., Lionnet, T., Vastenhouw, N., Kimura, H.
Source
Full text @ Development

Visualizing RNA polymerase II and histone modifications in living embryos. (A) Scheme of experiments. Fluorescently labeled Fabs prepared from modification-specific antibodies are injected into 1-cell-stage zebrafish embryos. After the removal of chorions, the embryos are mounted for a light-sheet (SiMView) or a confocal (FV1000) microscope using low-gelling temperature agarose at the 4-cell stage. (B,C) Representative images taken with a SiMView microscope. (B) Fabs specific to RNAP2 Ser2ph (Alexa 488) and H3K9ac (Cy5) were simultaneously injected and imaged using SiMView. RNAP2 Ser2ph Fabs were clearly concentrated in nuclei around the 1k-cell stage, whereas H3K9ac Fabs were enriched in nuclei from the 8-cell stage. Maximum intensity projections of 198 z-sections with 2 μm intervals are shown. Insets show magnified views of the indicated areas. Yellow arrows indicate RNAP2 Ser2ph foci in nuclei. See also Movie 1. Scale bar: 100 μm. (C) Close association of RNAP2 Ser2ph foci with miR-430 transcripts. Embryos were injected with RNAP2 Ser2ph-Fab (Alexa 488) and miR-430 morpholino (Cy3). Maximum intensity projections (30 z-planes with 2 μm intervals) at the 1k-cell stage are shown. See also Movie 2. Scale bar: 10 μm.

Changes in the nuclear enrichments of Fabs specific to RNAP2 Ser2ph and H3K27ac during zebrafish embryo development. (A) Representative images of embryos injected with Fabs specific for RNAP2 Ser2ph (Alexa 488), H3K27ac (Cy3) and H3K9ac (Cy5). Single confocal sections for RNAP2 Ser2ph and H3K27ac are shown. Insets show magnified views of the indicated areas. Yellow arrows indicate RNAP2 Ser2ph foci in nuclei. Elapsed times (min:s) are indicated. See also Movie 3. Scale bar: 100 μm. (B) Nucleus/cytoplasm intensity ratios. Stages judged from time-lapse images are indicated. A graph representing the number of measured nuclei is shown at the bottom. The global level of H3K27ac in nuclei increased slightly earlier than that of RNAP2 Ser2ph. (C) Changes in the nuclear enrichments of Fabs specific for various RNAP2 and histone modifications. Relative nucleus/cytoplasm (N/C) intensity ratios, relative to those of the 32-cell stage, are shown for various modifications and a control (mean±s.d. of 3 embryos).

Dynamics of histone H3K27ac and transcription foci at the 256- and 512-cell stages. (A) Simultaneous visualization of RNAP2 Ser2ph and H3K27ac at the 256- and 512-cell stages. Embryos were injected with Fabs specific for RNAP2 Ser2ph (Alexa 488), H3K27ac (Cy3) and H3K9ac (Cy5). Single confocal sections for RNAP2 Ser2ph and H3K27ac are shown. RNAP2 Ser2ph accumulated close to H3K27ac foci. Arrows indicate H3K27ac and RNAP Ser2ph foci in the nucleus. Magnified and merged images of foci are shown in insets (H3K27ac, magenta; RNAP2 Ser2ph, green). Elapsed time (min:s) is indicated. See also Movies 6 and 7 for the 256- and 512-cell stages, respectively. Scale bar: 10 μm. (B) Relative intensity of foci. The intensity of H3K27ac and RNAP2 Ser2ph foci was measured and normalized to that of the whole nucleus to yield the foci/nucleus ratio.

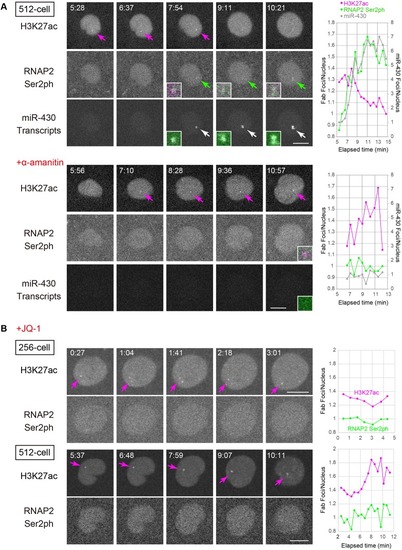
α-Amanitin does not affect H3K27ac but JQ-1 inhibits RNAP2 Ser2ph foci. (A) Effects of α-amanitin, an RNA polymerase inhibitor, on RNAP2 Ser2ph, H3K27ac, and miR-430 transcription. Embryos were injected with Fabs specific for RNAP2 Ser2ph (Alexa 488) and H3K27ac (Cy3) and miR-430 morpholino (Cy5). In some cases, the embryos were then injected with α-amanitin. Single confocal sections are shown. Arrows indicate H3K27ac, RNAP2 Ser2ph, and miR-430 transcript foci in nuclei. Magnified and merged images of foci are shown in insets (H3K27ac, magenta; RNAP2 Ser2ph, green; miR-430 morpholino, gray). Graphs on the right show the changes in relative focus intensities by time. The intensities of H3K27ac, RNAP2 Ser2ph, and miR-430 foci were measured and normalized to those of the whole nucleus to yield foci/nucleus ratios. After α-amanitin injection, RNAP2 Ser2ph and miR-430 morpholino were not accumulated in foci at the 512-cell stage, whereas H3K27ac still accumulated in foci. See also Movies 8 and 9 for embryos without and with α-amanitin, respectively. (B) Effects of JQ-1, a BET domain binder, on RNAP2 Ser2ph and H3K27ac. Embryos were injected with Fabs specific for RNAP2 Ser2ph (Alexa 488), H3K27ac (Cy3) and H3K9ac (Cy5), and then soaked in 10 μM JQ-1. Single confocal sections for RNAP2 Ser2ph and H3K27ac are shown. Graphs on the right show the changes in relative focus intensities by time, as in A. RNAP2 Ser2ph focus formation was inhibited by JQ-1. Elapsed time (min:s) is indicated. See also Movies 10 and 11 for the 256- and 512-cell stages, respectively. Scale bars: 10 μm.

Acknowledgments
This image is the copyrighted work of the attributed author or publisher, and ZFIN has permission only to display this image to its users. Additional permissions should be obtained from the applicable author or publisher of the image. Full text @ Development