IMAGE

Fig. 4.

ID
ZDB-IMAGE-191230-426
Source
Figures for Sato et al., 2019
Image
Figure Caption

Fig. 4.

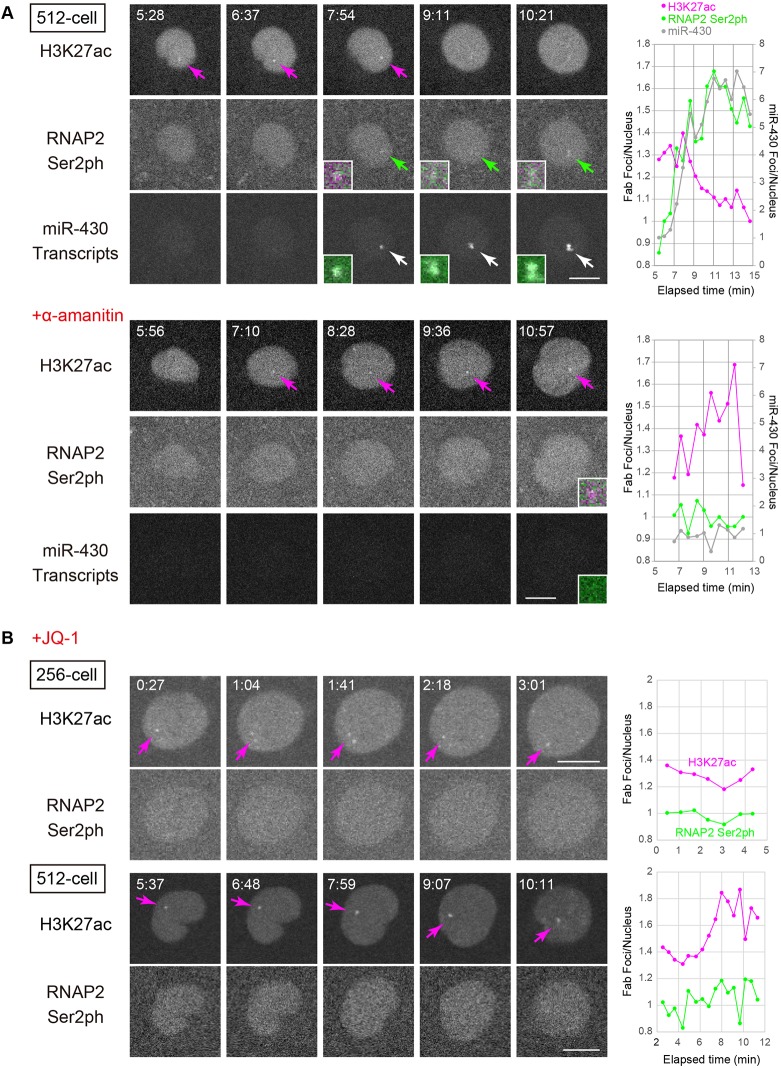
α-Amanitin does not affect H3K27ac but JQ-1 inhibits RNAP2 Ser2ph foci. (A) Effects of α-amanitin, an RNA polymerase inhibitor, on RNAP2 Ser2ph, H3K27ac, and miR-430 transcription. Embryos were injected with Fabs specific for RNAP2 Ser2ph (Alexa 488) and H3K27ac (Cy3) and miR-430 morpholino (Cy5). In some cases, the embryos were then injected with α-amanitin. Single confocal sections are shown. Arrows indicate H3K27ac, RNAP2 Ser2ph, and miR-430 transcript foci in nuclei. Magnified and merged images of foci are shown in insets (H3K27ac, magenta; RNAP2 Ser2ph, green; miR-430 morpholino, gray). Graphs on the right show the changes in relative focus intensities by time. The intensities of H3K27ac, RNAP2 Ser2ph, and miR-430 foci were measured and normalized to those of the whole nucleus to yield foci/nucleus ratios. After α-amanitin injection, RNAP2 Ser2ph and miR-430 morpholino were not accumulated in foci at the 512-cell stage, whereas H3K27ac still accumulated in foci. See also Movies 8 and 9 for embryos without and with α-amanitin, respectively. (B) Effects of JQ-1, a BET domain binder, on RNAP2 Ser2ph and H3K27ac. Embryos were injected with Fabs specific for RNAP2 Ser2ph (Alexa 488), H3K27ac (Cy3) and H3K9ac (Cy5), and then soaked in 10 μM JQ-1. Single confocal sections for RNAP2 Ser2ph and H3K27ac are shown. Graphs on the right show the changes in relative focus intensities by time, as in A. RNAP2 Ser2ph focus formation was inhibited by JQ-1. Elapsed time (min:s) is indicated. See also Movies 10 and 11 for the 256- and 512-cell stages, respectively. Scale bars: 10 μm.

Acknowledgments
This image is the copyrighted work of the attributed author or publisher, and ZFIN has permission only to display this image to its users. Additional permissions should be obtained from the applicable author or publisher of the image. Full text @ Development