FIGURE SUMMARY
Title

Zika virus enhances monocyte adhesion and transmigration favoring viral dissemination to neural cells

Authors
Ayala-Nunez, N.V., Follain, G., Delalande, F., Hirschler, A., Partiot, E., Hale, G.L., Bollweg, B.C., Roels, J., Chazal, M., Bakoa, F., Carocci, M., Bourdoulous, S., Faklaris, O., Zaki, S.R., Eckly, A., Uring-Lambert, B., Doussau, F., Cianferani, S., Carapito, C., Jacobs, F.M.J., Jouvenet, N., Goetz, J.G., Gaudin, R.
Source
Full text @ Nat. Commun.

Monocyte-derived cells are infected by ZIKV in a human fetus with microcephaly. ae Immunohistochemical staining was performed on human fetal brain tissues from a PCR-confirmed case of congenital ZIKV (gestational age 22 weeks). All slides were counterstained in Mayer’s Hematoxylin and blued in Lithium carbonate. The tissue slices were stained for ZIKV–NS1 in combination with a CD45 (left panel: 63×, right panel: 40×), b CD14 (20×), c CD68 (upper panel: 63×, lower left panel: 100×, and lower right panel: 40×), or d CD163 (upper panel: 40×, lower left panel: 100×, and lower right panel: 63×). e The endothelial cells of slices from the same tissue appear morphologically intact and were never found positive for ZIKV–NS1 staining. The black arrowheads indicate ZIKV-infected cells. BV blood vessel

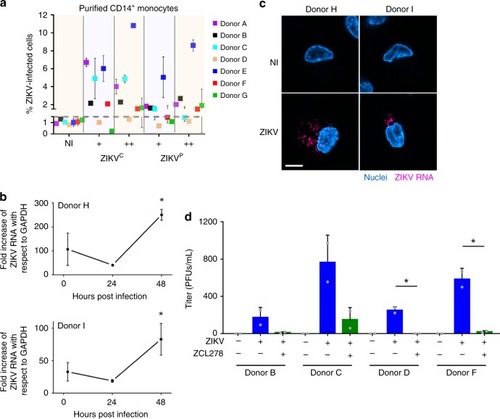
Human primary monocytes are productively infected by ZIKV. a Monocytes purified from seven healthy blood donors were infected with Colombian (ZIKVC) or Panama (ZIKVP) ZIKV strains at MOI 1 (+) or 5 (++) for 48 h. Cells were fixed, permeabilized, and processed for flow cytometry. The percentage of ZIKV-infected cells (NS2B+) is plotted as a function of the strain and amount of ZIKV used. Each dot corresponds to the mean ± SD of ZIKV-infected cells for each donor and each condition in two individual samples. b Monocytes were infected for the indicated time with ZIKV (MOI 1) for 48 h. Total RNA was extracted and RT-qPCR was performed by using ZIKV and GAPDH-specific primers. The graph represents the fold change of ZIKV RNA with respect to GAPDH of a triplicate ± SD. Data from two donors are shown. No ZIKV RNA was detected in monocytes from a third donor in this experiment (data provided in the Source Data file). c Monocytes infected with ZIKV for 48 h were fixed and fluorescence in situ hybridization (FISH) was performed by using a ZIKV-specific RNA probe (magenta) and nuclei were stained with NucBlue (blue). Left and right panels are representative images from experiments done with two donors. Scale bar: 5 µm. d Monocytes purified from four healthy donors were untreated or pretreated with 50 µM ZCL278 for 30 min at 37 °C. The cells were then infected with ZIKV (MOI 1) in the presence or absence of ZCL278. The inoculum was removed at 4 h post infection, after which the cells were washed and re-incubated in complete media for 48 h. The supernatant was harvested and a plaque assay on Vero cells was performed to titrate ZIKV production. The bar graphs represent the mean + SD of two independent samples. Each dot represents the mean of a duplicate. ZCL278 treatment inhibited ZIKV infection of monocytes by 93% (±7). The letters attributed to each donor correlate with the ones in a. The two-tailed p value was <0.05 (*). Statistical significance was determined by using a t test. NI noninfected. Source data in ad are provided as a Source Data file

ZIKV-infected monocytes promote viral dissemination and tissue damage to cerebral organoids. a, b Cerebral organoids of 3 or 5 weeks post differentiation (wpd) were cocultured with ZIKV-infected monocytes, noninfected monocytes, cell-free ZIKV, or mock for 2 days. The organoids were then fixed and processed for a immunofluorescence or b flow cytometry. a A slice and the 3D view of the same organoid are shown, which was cocultured with ZIKV-infected monocytes. The crop shows infected cells (not monocytes) in yellow. Scale bar: 50 µm. b The bar graphs represent the mean of an experiment performed in duplicate ± SD with monocytes from two donors. ce Organotypic cultures of mouse cerebellar slices were cultured in the presence or absence of cell-free ZIKV or ZIKV-infected monocytes ± ZCL278. c Experimental design. d A staining with an anti-calbindin antibody (green) and Dapi (blue) was done to observe the tissue cytoarchitecture. Scale bar: 500 µm. e The cytoarchitecture index is a measurement of the degree of tissue injury. Three categories were defined: healthy (part of the lobule with a regular alignment of Purkinje), intermediate (partially damaged, sparse Purkinje), or altered (absence of Purkinje, impaired on the slice). For each condition, the length of the healthy, intermediate, or altered regions was measured by using ImageJ and the proportion of each category was plotted. The condition in which cerebellar slices were incubated with ZIKV-infected monocytes is the only one that significantly differed from the others. Two-tailed p value < 0.05 (*). Statistical significance was determined by using a t test. NI noninfected. Source data in b, e are provided as a Source Data file

ZIKV-infected monocytes exhibit higher transmigration properties. a Representative scheme of the transwell transmigration assay. b After a transmigration assay was performed, the hCMEC/D3 monolayer was harvested from the transwell membrane, fixed, and processed for flow cytometry. The cells were stained with a NS2B antibody to assess for viral infection. The graph shows the mean ± SD of two independent experiments done in triplicate with two donors. c Monocytes were noninfected or infected with ZIKV at MOI 1 for 48 h. Upon extensive washes, monocytes were added on top of a transwell insert onto which hCMEC/D3 endothelial cells were plated 7 days before addition. Transmigration was allowed to occur for ≈17 h. Monocytes from the top and bottom chambers were harvested, fixed, and stained. Flow cytometry analysis was performed to determine the percentage of ZIKV-infected cells (NS2B+) among the monocytes that did not transmigrate (top, green circles) or did transmigrate (bottom, red squares). The graph shows two individual experiments from three donors. One of the replicates was not presented, because no infected cells were detected in the top or bottom chambers (see Source Data file for details). Monocytes from the top and bottom come from the same transwell. The fold change of the percentage of infected cells in the top and bottom chambers was significantly greater (two-way Anova = 0.039). de ZIKV-infected or noninfected (NI) monocytes isolated from two donors were cocultured for 17 h with a hCMEC/D3 monolayer previously grown on glass coverslips for 7 days. Upon fixation and staining with a fluorescently labeled anti-CD45 antibody, the number of monocytes located above, intermediate, or under the endothelial layer (as depicted in d) was quantified by confocal microscopy. e The pie charts correspond to the number of monocytes counted per ten fields of view from two individual experiments with two donors. Two-tailed p value < 0.05 (*). Statistical significance was determined by using a t test. NI noninfected, ns nonsignificant. Source data in b, c, e are provided as a Source Data file

ZIKV-exposed monocytes exhibit higher adhesion properties. a, b Monocytes from two donors were infected with ZIKV. At 48 hpi, the cells were processed for quantitative proteome profiling by using liquid chromatography coupled to tandem mass spectrometry (LC–MS/MS). Cluster and ontology analyses of the upregulated proteins (virus over mock) were identified by using STRING (a) and GSEA (b) methods. The list of the proteins modulated upon ZIKV infection by using a 5% FDR (p value < 0.0085) is provided in Supplementary Data 1. c Flow cytometry analysis assessing the surface expression of 22 adhesion molecules upon ZIKV infection. Each dot corresponds to the average fold change of duplicates for individual donors. The red lines correspond to the mean from three donors. The gray dashed line indicates a fold change of 1 (no differential expression between infected and noninfected monocytes). d The expression of CD99 (MIC2) was measured in monocytes from two donors treated with mock or ZIKV for 48 h. In the latter, the CD99 expression was quantified within the noninfected (ZIKV–) and the infected (ZIKV+) populations. e Expression of CD99 was measured over time on monocytes from two donors treated with mock, ZIKV, and UV-inactivated ZIKV. The bar graphs show the fold change of CD99 expression with respect to mock (mean ± SD). f Noninfected/nontreated (NI/NT), hGM-CSF-treated, ZIKV-, or HIV-infected monocytes were plated in wells coated with collagen, ICAM-1 protein, or fibronectin. The relative number of cells was measured by using CellTiter-Glo. Each bar graph corresponds to an experiment performed on monocytes from two healthy donors showing the mean ± SD from two individual experiments. g, h ZIKV-infected or NI monocytes of two donors were cocultured with hCMEC/D3 cells grown on glass coverslips. Upon fixation and staining with an anti-CD45 antibody, the number of adherent monocytes was quantified by confocal microscopy (g and Supplementary Fig. 9a, b). Scale bar: 20 µm. h The bar graph corresponds to the mean ± SD of the number of monocytes counted per ten fields of view from two individual experiments for two donors. Two-tailed p value was nonsignificant (ns), <0.05 (*), <0.005 (**), or <0.0005 (***). Statistical significance was determined by using a t test. NI noninfected, NT no cytokine treatment. Source data in bf, h are provided as a Source Data file

ZIKV induces a spread-out morphology of monocytes. a Noninfected (NI) or ZIKV-infected monocytes were plated in wells coated with fibronectin. Upon fixation, cells were permeabilized and stained with Phalloidin A568 (yellow) and Dapi (blue). Images were acquired with a spinning-disk confocal microscope. For each condition, the images show a top view of the unprocessed fluorescence signal of a field of view (upper right) and isosurface-processed 3D reconstructions in the side view (down left). Scale bar: 10 µm. b ZIKV-infected or noninfected (NI) monocytes from two healthy donors were added to hCMEC/D3 and processed as mentioned in Fig. 5g. The relative projected area (area covered by the surface of individual monocytes) was measured at the indicated times post monocyte addition to the endothelial layer. Each bar graph corresponds to an experiment performed on monocytes from two donors showing the mean +/− SEM from two individual experiments. c Circularity of individual monocytes was measured 17 h after monocyte–hCMEC/D3 coculture by using ImageJ. Each dot corresponds to a single monocyte and the red bars correspond to the mean ± SEM from two individual experiments from two donors. A circularity value of 1 indicates a perfect circle and as the value approaches 0, it indicates an increasingly elongated polygon. d A transmigration assay in a transwell was performed with noninfected (NI) or 48 h ZIKV-infected (ZIKV) monocytes in the presence or absence of 50 µM ZCL278. The ratio of transmigrating cells between ZCL278-treated and untreated samples is shown. Each dot corresponds to an individual donor. Two-tailed p value was nonsignificant (ns), <0.05 (*) or <0.0005 (***). Statistical significance was determined by using a t test. Source data in bd are provided as a Source Data file

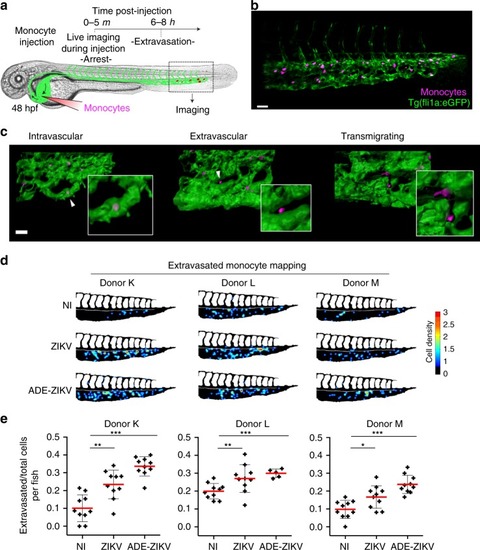
ZIKV enhances monocyte transmigration in zebrafish embryos. a Representative scheme of the experimental design associated with the zebrafish model. Human primary monocytes were noninfected (NI), or infected for 48 h with ZIKV in the absence (ZIKV) or presence (ADE–ZIKV) of 20 ng/mL of the 4G2-enhancing pan-Flaviviridae antibody (see Supplementary Fig. 10), stained with CellTrace, and injected into the duct of Cuvier of Tg(fli1a:eGFP) zebrafish embryos (GFP-labeled endothelial cells44). b Zebrafish imaging was done at 6–8 h post injection by scanning confocal microscopy. Representative 3D confocal image of the monocytes’ distribution within the tail of a zebrafish embryo vasculature (associated with Supplementary Movie 1) at 6 h post injection. Scale bar: 40 µm. c Three-dimensional reconstruction of the endothelium (green) and monocytes (magenta) that remained in the bloodstream (left panel, intravascular), transmigrated (middle panel, extravascular), or in the process of transmigrating (right panel). Scale bar: 25 µm. d Cell dispersion was manually counted and localized in the caudal plexus by using the stereotype patterning of intersegmental vessels (ISVs) as a reference. The data were compiled to generate heatmaps by using a custom-made MATLAB plugin. Representative heatmaps are represented for fish injected with monocytes from three individual donors. e Quantification of the mean ± SD of the ratio of extravasated monocytes (from the three donors used in d at 6–8 h post injection. Each cross represents the ratio calculated from all the monocytes tracked within a fish. Acquisition of the different conditions was performed in random order. Two-tailed p value < 0.05 (*), <0.005 (**), and <0.0001 (***). Statistical significance was determined by using a t test. Source data in  e are provided as a Source Data file

ZIKV favors monocyte arrest in zebrafish vessels, but does not affect their arresting time. Human primary monocytes from three donors were treated and injected as in Fig. 7a, and imaged with an epifluorescence microscope immediately after injection (0–5 min). a Micrographs representing the type of movement observed (Supplementary Movie S2). White arrowheads indicate examples of monocytes circulating (left panels), stopping (middle panels), or undergoing a rolling-like movement (right panels). Note that timescales are different for each behavior. The yellow arrow represents the direction of the bloodstream. Scale bar: 40 µm. bg Monocytes were automatically tracked over time. b The track duration (in seconds) of each monocyte was quantified. Each dot corresponds to a single monocyte tracked over ≈5 min and the red line represents the mean (NI n = 2 fish; ZIKV n = 3 fish; ADE–ZIKV n = 3 fish). c Color-coded representation of monocyte speed in the zebrafish vasculature. Red tracks indicate arrested monocytes. d, e Quantification of the mean track speed of monocytes. Each red dot corresponds to a single monocyte tracked over ≈5 min. d The box plots are representative of the data of one fish. The center line is the median, the box extends from 25th to 75th percentiles, and the whiskers include from the smallest to the largest value. e The bar graph shows the mean ± SD of NI n = 2 fish, ZIKV n = 3 fish, and ADE–ZIKV n = 3 fish per condition. Each dot is one tracked monocyte. Quantification of f the percentage and g the arrest length (in seconds) among the monocytes that arrested for more than 2 s. f, g The bar graphs represent the mean ± SEM. Each dot represents the mean of all monocytes tracked in a given fish (NI n = 2 fish (139 tracks), ZIKV n = 3 fish (269 tracks), and ADE–ZIKV n = 3 fish (316 tracks)). Two-tailed p value was ns = nonsignificant, <0.05 (*), <0.005 (**), and <0.0001 (***). Statistical significance was determined by using a t test. Source data in b, e, g are provided as a Source Data file

Transmigrated ZIKV-infected monocytes promote viral dissemination to cerebral organoids. a Representative scheme of the experimental design. Neural organoids were located under a transwell where hCMEC/D3 cells were previously grown for 7 days. On top of a transwell, ZIKV-infected monocytes from two healthy donors, not-infected monocytes, cell-free ZIKV, or mock were added. After an overnight incubation, the transwells were removed and the organoids were cultured for 2 or 9 days, and then they were fixed and processed for b immunofluorescence or c flow cytometry. The bar graph shows the mean of an experiment performed in duplicate ± SD. Two-tailed p value < 0.05 (*). Statistical significance was determined by using a t test. Scale bar: 50 µm. Source data in c are provided as a Source Data file

Acknowledgments
This image is the copyrighted work of the attributed author or publisher, and ZFIN has permission only to display this image to its users. Additional permissions should be obtained from the applicable author or publisher of the image. Full text @ Nat. Commun.