FIGURE SUMMARY
Title

Exposure of Larval Zebrafish to the Insecticide Propoxur Induced Developmental Delays that Correlate with Behavioral Abnormalities and Altered Expression of hspb9 and hspb11

Authors
Shields, J.N., Hales, E.C., Ranspach, L.E., Luo, X., Orr, S., Runft, D., Dombkowski, A., Neely, M.N., Matherly, L.H., Taub, J., Baker, T.R., Thummel, R.
Source
Full text @ Toxics

Propoxur exposure during zebrafish development results in three distinct developmental delay phenotypes: (A) Percent viability of treated embryos at varying propoxur concentrations; (B) percent viability of embryos in untreated, 1% DMSO-treated, and 100 ug/mL propoxur-treated groups; (C) percent of delay phenotypes present in untreated, DMSO-treated, or propoxur-treated groups; visual representation of phenotypic groups at 40 hpf: (D) no delay, (E) mild delay, and (F) severe delay. (G,H) Acridine orange uptake shows an increase in fluorescent puncta (arrowheads) associated with the severe delay group compared with the no delay group. These puncta are distinct from the autofluorescence observed in the anal yolk extension (aye) in both groups. The panel insets for Figure 1G,H are shown in Figure 1D,F, respectively; (I) Western blot analysis of the G1/S protein Proliferating Cell Nuclear Antigen (PCNA) shows reduced PCNA expression in the severe delay groups, suggestive of reduced cell proliferation.

Zebrafish with propoxur-induced delays undergo physical recovery to obtain the general appearance of control zebrafish by 7 days postfertilization: (A) DMSO-treated control group; (B) propoxur-treated group exhibiting phenotype of no delay; (C) propoxur-treated group exhibiting phenotype of mild delay; and (D) propoxur-treated group exhibiting phenotype of severe delay.

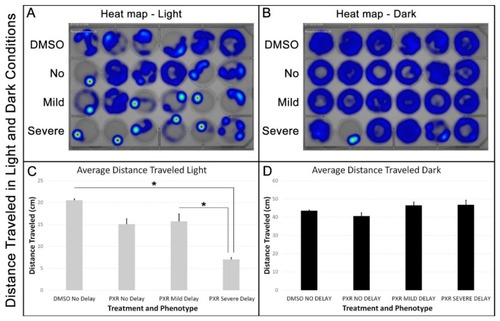
Zebrafish severely delayed by propoxur treatment showed greater aversion to light with less movement at 7 days postfertilization: (A) Heat map representation of the concentration of movement for each group during a single light interval; (B) heat map representation of the concentration of movement for each group during a single dark interval; (C) graphical representation of the average distance traveled for each group during the cumulative light intervals. The asterisks indicate a significant difference between the groups; and (D) graphical representation of the average distance traveled for each group during the cumulative light intervals.

Abnormal movements observed in zebrafish at 7 dpf that were severely delayed by propoxur treatment at 40 hpf. (A) Graphical representation of the distance moved into 30-second bins: severely delayed fish (red circles) displayed extreme light aversion and a delayed response to movement in the dark. (B) Graphical representation of the turn angle into 30-second bins: severely delayed fish (red circles) displayed extreme changes in turn angle. (C) Graphical representation of the average velocity of movement in light and dark. (D) Graphical representation of the average percentage traveled in light and dark: asterisk represents statistical differences compared with group indicated in the graph (p < 0.01).

Acknowledgments
This image is the copyrighted work of the attributed author or publisher, and ZFIN has permission only to display this image to its users. Additional permissions should be obtained from the applicable author or publisher of the image. Full text @ Toxics