IMAGE

Figure 4

ID
ZDB-IMAGE-200125-68
Source
Figures for Shields et al., 2019
Image
Figure Caption

Figure 4

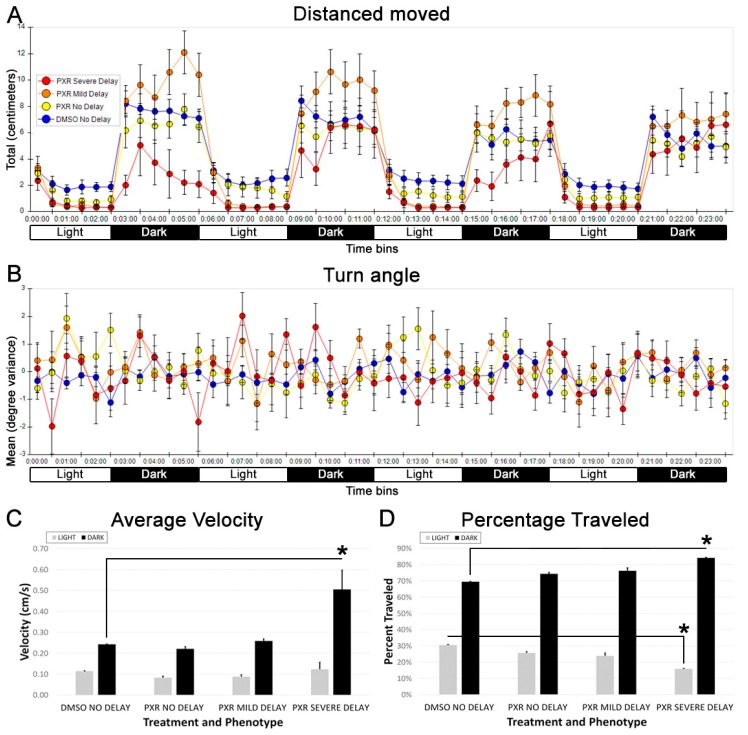
Abnormal movements observed in zebrafish at 7 dpf that were severely delayed by propoxur treatment at 40 hpf. (A) Graphical representation of the distance moved into 30-second bins: severely delayed fish (red circles) displayed extreme light aversion and a delayed response to movement in the dark. (B) Graphical representation of the turn angle into 30-second bins: severely delayed fish (red circles) displayed extreme changes in turn angle. (C) Graphical representation of the average velocity of movement in light and dark. (D) Graphical representation of the average percentage traveled in light and dark: asterisk represents statistical differences compared with group indicated in the graph (p < 0.01).

Acknowledgments
This image is the copyrighted work of the attributed author or publisher, and ZFIN has permission only to display this image to its users. Additional permissions should be obtained from the applicable author or publisher of the image. Full text @ Toxics