FIGURE SUMMARY
Title

AMPK promotes induction of the tumor suppressor FLCN through activation of TFEB independently of mTOR

Authors
Collodet, C., Foretz, M., Deak, M., Bultot, L., Metairon, S., Viollet, B., Lefebvre, G., Raymond, F., Parisi, A., Civiletto, G., Gut, P., Descombes, P., Sakamoto, K.
Source
Full text @ FASEB J.

AMPK-activation profiles in samples used for transcriptome analyses. A) MEFs WT (AMPKα1α2+/+) or KO (AMPKα1α2−/−) were treated with vehicle (DMSO), 2 mM AICAR or 10 µM 991 for 4 h. Cell lysates (20 µg) were subjected to Western blot analysis with the indicated antibodies and a representative blot of n = 3 is shown. B) Hepatocytes were isolated from AMPKα1/α liver-specific KO (AMPKα1α2−/−) mice and control AMPKα1lox/lox α2lox/lox mice littermates (AMPKα1α2+/+). The plated hepatocytes were treated for 4 h with vehicle (DMSO), 3 µM 991, or 300 µM AICAR. Cell lysates (20 µg) were subjected to Western blot analysis using the indicated antibodies. Images are representative of n = 2.

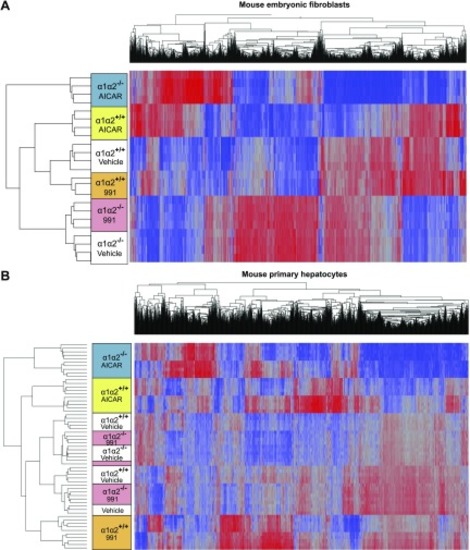
Hierarchical clustering of the transcriptome data. Overview of the hierarchical clustering analyses in MEFs (A) and mouse primary hepatocytes (B). Mean-centered gene expression ratios are depicted by a log2 pseudocolor scale; red indicates that the gene is overexpressed compared to the mean value, whereas blue specifies that the gene is less expressed. Data were analyzed by 2-way ANOVA with the factors of genetic background, treatment, and interaction. Only selected genes having a FDR of P < 0.0001 for the interaction are shown.

Transcriptome data analysis of the AMPK-activation response following treatment with 991 and AICAR. Venn diagrams showing the transcriptome profiling specificity of 991 and AICAR in MEFs (A) and mouse primary hepatocytes (B). Two-way ANOVA with Benjamini and Hochberg multiple testing correction was applied to discriminate 991 vs. control and AICAR vs. control conditions. The moderated significance value was set at P < 0.05 for the interaction between the genetic background and treatment, as well as for the pairwise comparisons, and a fold-change cutoff of 1.3 was applied. Each group of transcripts is shown with a color code, as specified in the figure. The numbers correspond to the numbers of transcripts altered and the percentage contribution to the total number of transcripts identified for each treatment, respectively. The surface of each circle is proportional to the total number of transcripts it contains.

Identification of pathways and genes modulated by AMPK.
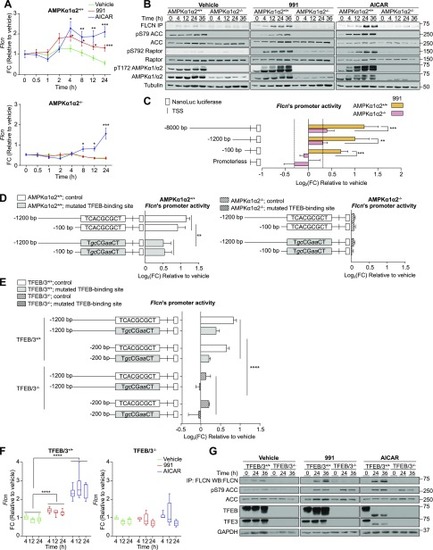
 A, B) Gene enrichment analysis of the 991-responsive signature in MEFs (A) and mouse primary hepatocytes (B). DAVID was used to explore the gene ontology terms associated to the AMPK-regulated genes. The bars represent the negative log10 (P value) of enriched terms, indicating the significance of association between the gene list and an indicated ontology term. C, D) Relative mRNA levels of the indicated genes are displayed following qPCR analysis in MEFs (C) and primary hepatocytes (D). AMPKα1α2+/+ or AMPKα1α2−/− MEFs were stimulated with 10 µM 991 or 2 mM AICAR for 4 h, and AMPKα1α2+/+ or AMPKα1α2−/− hepatocytes were treated with 3 µM 991 or 300 µM AICAR for 4 h. The color corresponds to the 2 treatment conditions and 2 cellular models, as indicated in the figure. Values are represented as log2 fold-change of the mean ± sd (n = 9). The gray shaded area indicates the log2 fold-change threshold of ±0.37. For the analysis, a 2-way ANOVA with interaction was fit to log-transformed data. *P < 0.05, **P < 0.01, ***P < 0.001.

Identification of Flcn as an AMPK-regulated gene and TFEB as a transcription factor that mediates this response. A) Relative Flcn mRNA levels were assessed with a Biomark gene expression 192.24 IFC δ gene assay. AMPKα1α2+/+ or AMPKα1α2−/− MEFs were treated with vehicle (DMSO), 10 µM 991 or 2 mM AICAR, for 0, 0.5, 1, 2, 4, 8, 12, and 24 h. Two-way ANOVA with interaction was fit to log-transformed data. *P < 0.05, **P < 0.01, ***P < 0.001. Each data point represents the mean ± sem (n = 12). B) AMPKα1α2+/+ or AMPKα1α2−/− MEFs were treated with 10 µM 991 or 2 mM AICAR for the indicated time points. FLCN was immunoprecipitated (IP) from cell lysates and subjected to Western blot analysis with the FLCN antibody. A representative blot of 3 independent experiments is shown. C) Schematic representation of Flcn-NanoLuc luciferase reporter plasmid and the correspondent luciferase activity profile. Different lengths of Flcn’s promoter region (−8000, −1200, and −100 bp) were inserted upstream of the NanoLuc luciferase reporter gene. The constructs, along with a firefly luciferase plasmid, which served as internal control, were transiently transfected into AMPKα1α2+/+ or AMPKα1α2−/− MEFs. Twelve hours post-transfection, cells were treated with vehicle (DMSO) or 30 µM 991 for 12 h, then harvested and luciferase assay was performed. Values were first normalized by transfection efficiency, and then represented as log2 fold-change ±sd, relative to control (vehicle-treated cells) (n = 3). The dotted lines indicate the log2 fold-change threshold of ±0.37. Data were analyzed by 2-way ANOVA with the factors of genetic background and promoter length, plus the interaction between the 2 factors. Significance of the genetic background is indicated. ***P < 0.001, **P < 0.01. TSS, transcription start site. D) AMPKα1α2+/+ or AMPKα1α2−/− MEFs were transiently transfected with Flcn-NanoLuc luciferase (−1200 or −100 bp) either control or with a mutation on TFEB-binding site (position −40 bp from the TSS), together with a firefly luciferase plasmid for control, and treated as above. Values were first normalized by transfection efficiency, and then represented as log2 fold-change ± sd, relative to control (vehicle-treated cells) (n = 3). Data were analyzed by a 2-way ANOVA with the factors of promoter length and TFEB-binding site status (control or TFEB-mutated), plus the interaction between these 2 factors. Significance of the TFEB-binding site status is indicated. **P < 0.01. E) TFEB/TFE3 control (TFEB/3+/+) and double KO (TFEB/3−/−) MEFs were transiently transfected with Flcn-NanoLuc luciferase (−1200 or −200 bp) control or with a mutation on TFEB-binding site (position −40 bp), together with a firefly luciferase plasmid. Cells were then treated with vehicle (DMSO) or 30 µM 991. Values were normalized and represented as described in D (n = 4). Data were analyzed by 2-way ANOVA with the factors of genetic background, TFEB-binding site status (control or mutated) and interaction. Significance of the genetic background is indicated, ****P < 0.0001. F) mRNA level of Flcn in TFEB/3+/+ or TFEB/3−/− MEFs treated with 10 µM 991 or 2 mM AICAR for 4, 12, and 24 h. Data are presented as a box-and-whisker plots (minimum to maximum) of values normalized to control (vehicle-treated cells, 4 h). Data were analyzed by a 2-way ANOVA with the factors of time and treatment, plus the interaction between these 2 factors (n = 9). Significance of the treatment factor is indicated. ****P < 0.0001. G) TFEB/3+/+ and TFEB/3−/− MEFs were lysed after 0, 24, and 36 h of treatment with 10 µM 991 or 2 mM AICAR. Cell lysates (20 μg) were subjected to Western blot analysis using the indicated antibodies. FLCN was IP from 500 μg of cell lysate with 1 μg of anti-FLCN antibody. Images are representative of n = 2.

Pharmacological activation of AMPK leads to dephosphorylation and nuclear localization of TFEB. A) AMPKα1α2+/+ or AMPKα1α2−/− MEFs were treated with vehicle (DMSO), 10 µM 991, or 2 mM AICAR for 1 h. Cytoplasmic and nuclear fractions were prepared and lysates (20 µg) from the fractions were used for Western blot analysis of the indicated proteins. B) COS1 cells were transfected for 48 h with no vector (negative control) or the vector containing Flag-tagged TFEB WT or S142A mutant construct. The WT or mutant TFEB was immunoprecipitated (IP) from cell lysate (500 μg) with 1 μg of anti-Flag antibody and the immunoprecipitates were subjected to Western blot analysis, with total or phospho-S142 (pS142) TFEB antibodies. Images are representative of n = 2. C) MEFs were treated with AMPK activators (10 µM 991 or 2 mM AICAR) or various concentrations of mTOR inhibitor rapamycin (0.05, 0.1 and 0.5 µM) for 1 or 4 h. Cell lysates (20 µg) were subjected to Western blot analysis using the indicated antibodies. D) The experiment was performed as described in C, except Torin-2 (5 or 10 nM) was used as an alternative mTOR inhibitor. Images are representative of n = 2.

TFEB translocates to the nucleus upon AMPK stimulation independently of mTOR in mouse primary hepatocytes. A) AMPKα1α2+/+ or AMPKα1α2−/− mouse primary hepatocytes were isolated and cells were treated with 10 µM 991, 300 µM AICAR, 30 µM C13, or rapamycin 0.05 µM for 1 or 4 h. Western blot analysis of the indicated proteins was performed on cell lysates. B) Primary hepatocytes were isolated from AMPKα1α2−/− mice and were untreated (No) or coinfected with 3 adenoviruses (1:3 multiplicity of infection) in order to rescue the expression of the 3 subunits of AMPK (Flag-α2, β1, and γ1). Sixteen hours postinfection, the primary hepatocytes were treated for 1 h with vehicle (DMSO) or 10 µM 991. Cell lysates (20 µg) were used for Western blot analysis with the indicated antibodies. Images are representative of n = 3.

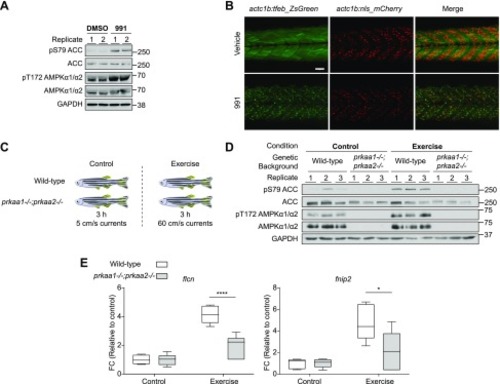
Activation of AMPK leads to translocation of TFEB to the nucleus and increased expression of flcn and fnip2 in zebrafish. A) Embryos at 3 dpf were treated with 991 10 µM or vehicle (DMSO) for 16 h. Tissue lysates (20 µg) were resolved by SDS-PAGE and Western blot analysis was performed using the indicated antibodies. B) Tg(actc1b:tfeb-ZsGreen);Tg(actc1b:nls-mCherry) embryos at 3 dpf were treated with 991 10 µM or vehicle (DMSO) for 24 h. Embryos were mounted live in water containing 0.016% tricaine and imaged with ImageXpress confocal system at original magnification, ×20, the scale bar corresponds to 50 µm (n = 12). C) Schematic summary of the acute exercise study design using WT and prkaa1−/−;prkaa2−/− zebrafish. D) Immediately after the 3-h training session, muscle samples were collected from the zebrafish. Tissue lysates (20 µg) were resolved by SDS-PAGE and Western blot analysis was performed using the indicated antibodies. E) Relative mRNA transcript levels of flcn and fnip2 were determined by qPCR. Data are shown as box-and-whisker plots (minimum to maximum) of values normalized to control WT (n = 6). Two-way ANOVA with the factors of genetic background and exercise, plus the interaction between these 2 factors, was performed. The graph shows the significance of the interaction. *P < 0.05, ****P < 0.0001.

Acknowledgments
This image is the copyrighted work of the attributed author or publisher, and ZFIN has permission only to display this image to its users. Additional permissions should be obtained from the applicable author or publisher of the image. Full text @ FASEB J.