IMAGE

Figure 4

ID
ZDB-IMAGE-191230-1503
Source
Figures for Collodet et al., 2019
Image
Figure Caption

Figure 4

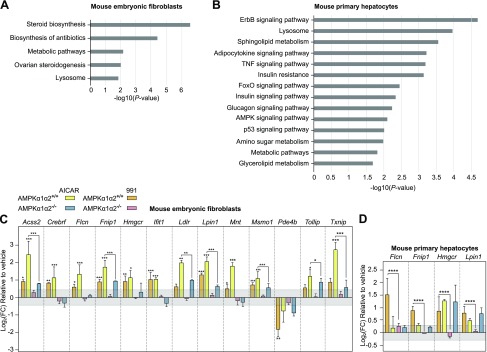
Identification of pathways and genes modulated by AMPK. A, B) Gene enrichment analysis of the 991-responsive signature in MEFs (A) and mouse primary hepatocytes (B). DAVID was used to explore the gene ontology terms associated to the AMPK-regulated genes. The bars represent the negative log10 (P value) of enriched terms, indicating the significance of association between the gene list and an indicated ontology term. C, D) Relative mRNA levels of the indicated genes are displayed following qPCR analysis in MEFs (C) and primary hepatocytes (D). AMPKα1α2+/+ or AMPKα1α2−/− MEFs were stimulated with 10 µM 991 or 2 mM AICAR for 4 h, and AMPKα1α2+/+ or AMPKα1α2−/− hepatocytes were treated with 3 µM 991 or 300 µM AICAR for 4 h. The color corresponds to the 2 treatment conditions and 2 cellular models, as indicated in the figure. Values are represented as log2 fold-change of the mean ± sd (n = 9). The gray shaded area indicates the log2 fold-change threshold of ±0.37. For the analysis, a 2-way ANOVA with interaction was fit to log-transformed data. *P < 0.05, **P < 0.01, ***P < 0.001.

Acknowledgments
This image is the copyrighted work of the attributed author or publisher, and ZFIN has permission only to display this image to its users. Additional permissions should be obtained from the applicable author or publisher of the image. Full text @ FASEB J.