
- Title
-
Endocrine regulation of multichromatic color vision
- Authors
- Mackin, R.D., Frey, R.A., Gutierrez, C., Farre, A.A., Kawamura, S., Mitchell, D.M., Stenkamp, D.L.
- Source
- Full text @ Proc. Natl. Acad. Sci. USA
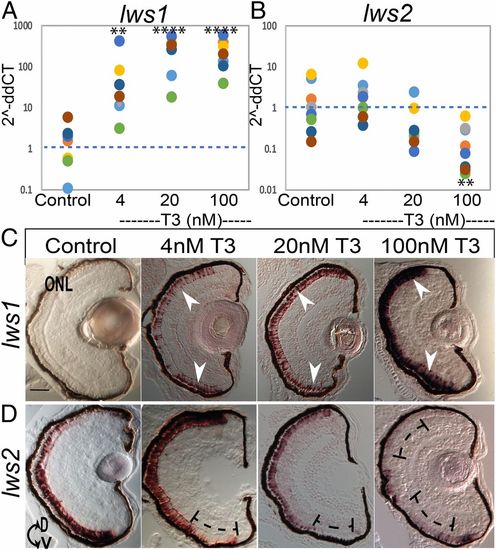
qPCR and in situ hybridization for lws transcript abundance reveals robust differential regulation after TH (T3) treatment from 2 to 4 dpf. (A and B) Scatter plots indicate fold-change (2−ddCT) abundance of the indicated transcripts. Colors of dots correspond to separate experiments. Each dot represents 1 biological sample (pooled RNA from ∼5 larvae). For each condition n = 8 (A). lws1 abundance in DMSO control, increased by 4 nM T3 P = 0.001502, increased by 20 nM T3 P = 0.000003, increased by 100 nM T3 P = 0.000002. (B) lws2 abundance in control was unchanged by both 4 nM T3 and 20 nM T3 P = 0.288195 and P = 0.073120 but decreased by 100 nM T3 P = 0.004823. P values were calculated by comparing the ddCT values for treated vs. control from each experiment using the Kruskal–Wallis test and the Conover post hoc test further adjusted by the Benjamini–Hochberg false-discovery rate method. Statistical notation: **P < 0.01, ****P < 0.0001. (C and D) In situ hybridization of cryosectioned eyes using gene-specific probes for lws1 (C) and lws2 (D) from larvae treated 2 to 4 dpf with DMSO (control) or T3. Arrows in C indicate induced and expanded expression domain of lws1 due to T3 treatment; brackets in D indicate regions showing reduced expression of lws2 due to T3 treatment. D, dorsal; V, ventral. (Scale bar in C [applies to C and D], 50 μm.) |
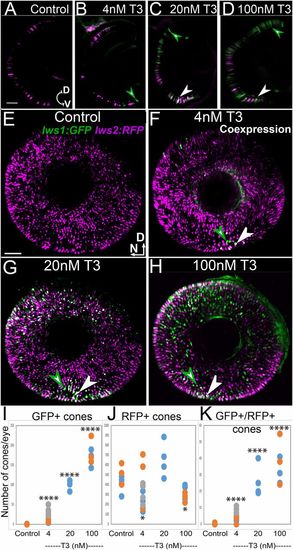
Lws reporter transgenic indicates a switch from lws2 to lws1 in response to TH (T3). (A–D) Cryosections from 4 dpf lws:PAC(H) eyes treated with DMSO (control; A), 4 nM T3 (B), 20 nM T3 (C), 100 nM T3 (D). (E–H) Whole-mounted lws:PAC(H) eyes visualized by confocal microscopy of DMSO (control) (E), 4 nM T3 (F), 20 nM T3 (G), 100 nM T3 (H). Green arrowheads indicate GFP+ cones, white arrowheads indicate colabeled cones. RFP is pseudocolored magenta. D, dorsal; N, nasal; V, ventral. (Scale bars in A [applies to A–D] and E [applies to E–H], 50 μm.) (I–K) GFP+ cone numbers, 4 nM T3 P = 1.28e-07, 20 nM T3 P = 2.47e-10, 100 nM T3 P = 4.46e-14 (I). RFP+ cones 4 nM T3 P = 0.022, 20 nM T3 P = 0.25, 100 nM T3 P = 0.03 (J) and (K) GFP+/RFP+ cone numbers, 4 nM T3 P = 2.3e-05, 20 nM T3 P = 9.8e-09, 100 nM T3 P = 4.0e-11 from 3 z-projected images from whole mounts of each condition show a dose-dependent increase in GFP-expressing (lws1+) cones. Colors of dots correspond to separate experiments. Each dot represents a biological replicate (an individual larva). P values were calculated by comparing the number of GFP+ or GFP+RFP+ cones for treated vs. control from each experiment using the Kruskal–Wallis test and the Conover post hoc test further adjusted by the Benjamini–Hochberg false-discovery rate method. Statistical notation: *P < 0.05, ****P < 0.0001. |
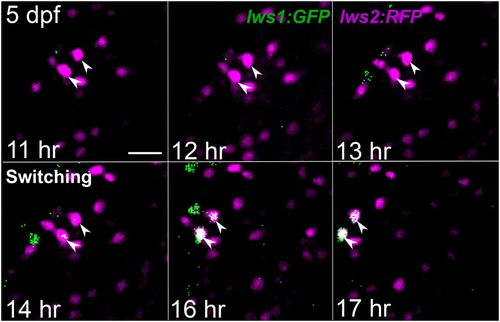
Live imaging of 5 dpf lws:PAC(H) lws reporter transgenic confirms a switch from lws2 to lws1 in individual cones in response to TH (T3). Imaging was conducted for 9 h starting 8 h after treatment with 100 nM T3 began. Time stamps indicate hours from start of imaging. Arrowheads show 2 RFP+ (lws2+) cones switching to express GFP (lws1) over the time of imaging. Cells move to the left of the region of interest due to growth of the larva. (Scale bar, 10 μm.) |
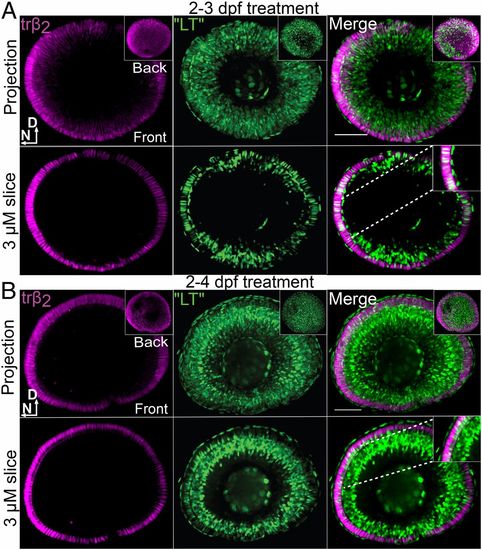
TH “ligand trap” reporter transgenic and trβ2 reporter transgenic indicate accumulation of TH (T3) in lws+ (TRβ2+) cones after T3 treatment. All panels include visualization of T3 accumulation (ligand trap, GFP+), trβ2+ cones (tdTomato+), and merge (colabeled cells are white) of whole-mounted eyes visualized by confocal microscopy, from larvae treated with 100 nM T3 from 2 to 3 dpf (A) or 2 to 4 dpf (B). D, dorsal; N, nasal. Insets in Upper rows of A and B show views of the back of the eye; Insets in Lower rows of A and B show higher magnification of a single 3-µm z-slice to visualize coexpressing cones. (Scale bars, 50 μm.) |
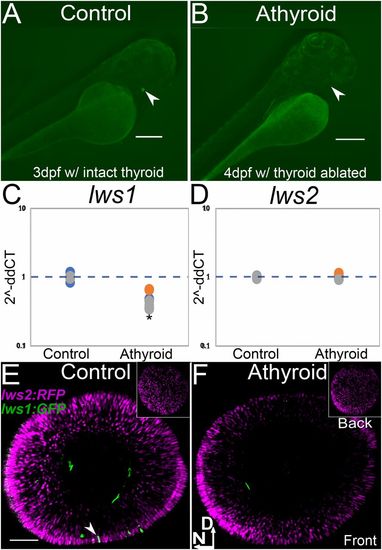
TH LOF by thyroid ablation suppresses lws1 expression at time of native onset of expression. (A and B) Transgenic [Tg(tg:nVenus-2a-nfnB)wp.rt8 that allows for thyroid ablation mediated by metronidazole treatment and nitroreductase expressing thyroglobulin cells] with intact thyroid, indicated by Venus (YFP) expression in embryo (A, arrowhead) and thyroid ablation, indicated by absence of Venus (YFP) (arrowhead shows normal location of thyroid gland) after 24-h treatment with metronidazole (B). (Scale bars in A and B, 250 μm.) (C and D) qPCR abundance of lws1 (C) and lws2 (D) transcripts (fold-change, 2−ddCT) in 6 dpf DMSO (control) and athyroid larvae. In comparison to control (n = 3) samples, lws1 is reduced in athyroid larvae (n = 3) P = 0.04 (C), and lws2 is not changed in athyroid larvae (n = 3) P = 0.32 (D). P values were calculated by comparing the ddCT values for the thyroid-ablated groups vs. controls from each experiment using a Wilcoxon Mann–Whitney U test. Statistical notation: *P < 0.05. (E and F) lws:PAC(H) lws reporter transgenic, whole-mounted eyes visualized by confocal microscopy of 6 dpf DMSO (control) (E) and athyroid larvae (F). Insets show views of the back of the eye; arrowhead in E indicates an lws1 (GFP+)-expressing cone; D, dorsal; N, nasal. (Scale bar in E [applies to E and F], 50 μm.) |
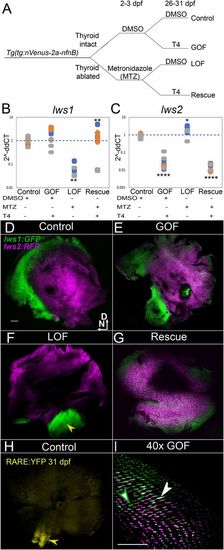
Plasticity of lws differential expression by TH (T4) in normal and athyroid juveniles. (A) Schematic of experimental workflow including thyroid ablation at 2 dpf followed by T4 treatment starting at 26 dpf for 5 d, of half the athyroid group and half of the controls. (B and C) qPCR of lws1 (A) and lws2 (B) transcript abundance. Scatter plots indicate fold-change abundance (2−ddCT) of the indicated transcripts. Colors of dots correspond to separate experiments. Each dot represents a biological replicate (2 retinas from an individual fish). lws1 abundance (B) in DMSO (control) (n = 9), is unchanged by T4 GOF (n = 9) P = 0.21 compared to control, decreased in athyroid (LOF) (n = 6) P = 0.006 compared to control, and increased in Rescue (LOF + T4) (n = 7) P = 0.006 compared to LOF. lws2 abundance (C) in control (n = 9), is decreased by T4 GOF (n = 9) P = 2.66e-06 compared to control, increased in LOF (n = 6) P = 4.38e-02 compared to control, and decreased in Rescue (n = 7) P = 3.61e-08 compared to LOF. ddCT values were calculated by subtracting the dCT value for each fish from the average dCT values from the control fish in each experiment. P values were calculated by comparing the ddCT values for each fish from each condition using the Kruskal–Wallis test and the Conover post hoc test further adjusted by the Benjamini–Hochberg false-discovery rate method. Statistical notation: *P < 0.05, **P < 0.01, ****P < 0.0001. (D–G) lws:PAC(H) whole-mounted retinas visualized by confocal microscopy of 31 dpf DMSO (control) (D), T4 (GOF) (E), athyroid (LOF) (F), and Rescue (LOF+T4) (G) juveniles. D, dorsal; N, nasal. Arrowhead in F indicates restricted ventral expression domain of lws1 in athyroid juvenile retina. (H) Whole-mounted retina of an age-matched RARE:eYFP juvenile showing domain of RA signaling restricted to ventral retina (arrowhead), and matching the domain of GFP (lws1) expression in athyroid retinas (arrowhead in F) of juvenile fish. (I) High-magnification view of lws:PAC(H) retina showing GFP/RFP colabeling (opsin switching) in T4-treated juveniles (not the same retina pictured in E). Green arrowhead indicates a GFP+ cone. White arrowhead indicates a colabeled (GFP+/RFP+) cone. (Scale bar in D [applies to D–H], 100 μm; in I, 50 μm.) |
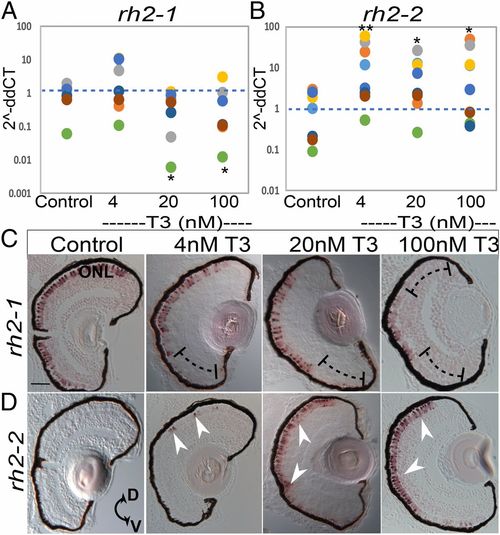
qPCR and in situ hybridization for rh2-1 and rh2-2 gene expression reveals differential regulation after TH (T3) treatment from 2 to 4 dpf. (A and B) Scatter plots indicate fold-change abundance (2−ddCT) of the indicated transcripts. Colors of dots correspond to separate experiments. Each dot represents 1 biological replicate (pooled RNA from ∼5 larvae). rh2-1 abundance (A) in DMSO control (n = 7), is unchanged by 4 nM T3 (n = 7) P = 0.53, decreased by 20 nM T3 (n = 7) P = 0.0186, and decreased by 100 nM T3 (n = 7) P = 0.0259. rh2-2 abundance (B) in control (n = 7), is increased by 4 nM T3 (n = 7) P = 0.0043, increased by 20 nM T3 (n = 7) P = 0.037 and increased by 100 nM T3 (n = 7) P = 0.026. P values were calculated by comparing the ddCT values for treated vs. control from each experiment using the Kruskal–Wallis test and the Conover post hoc test further adjusted by the Benjamini–Hochberg false-discovery rate method. Statistical notation: *P < 0.05, **P < 0.01. (C and D) In situ hybridization of cryosectioned eyes using gene specific probes for rh2-1 (C) and rh2-2 (D) from larvae treated 2 to 4 dpf with DMSO (control) or T3. Brackets in C indicate regions showing reduced expression domain of rh2-1 due to T3 treatment; arrowheads in D indicate regions showing induced and expanded expression domain of rh2-2 due to T3 treatment. D, dorsal; V, ventral. (Scale bar, 50 μm.) |