
|
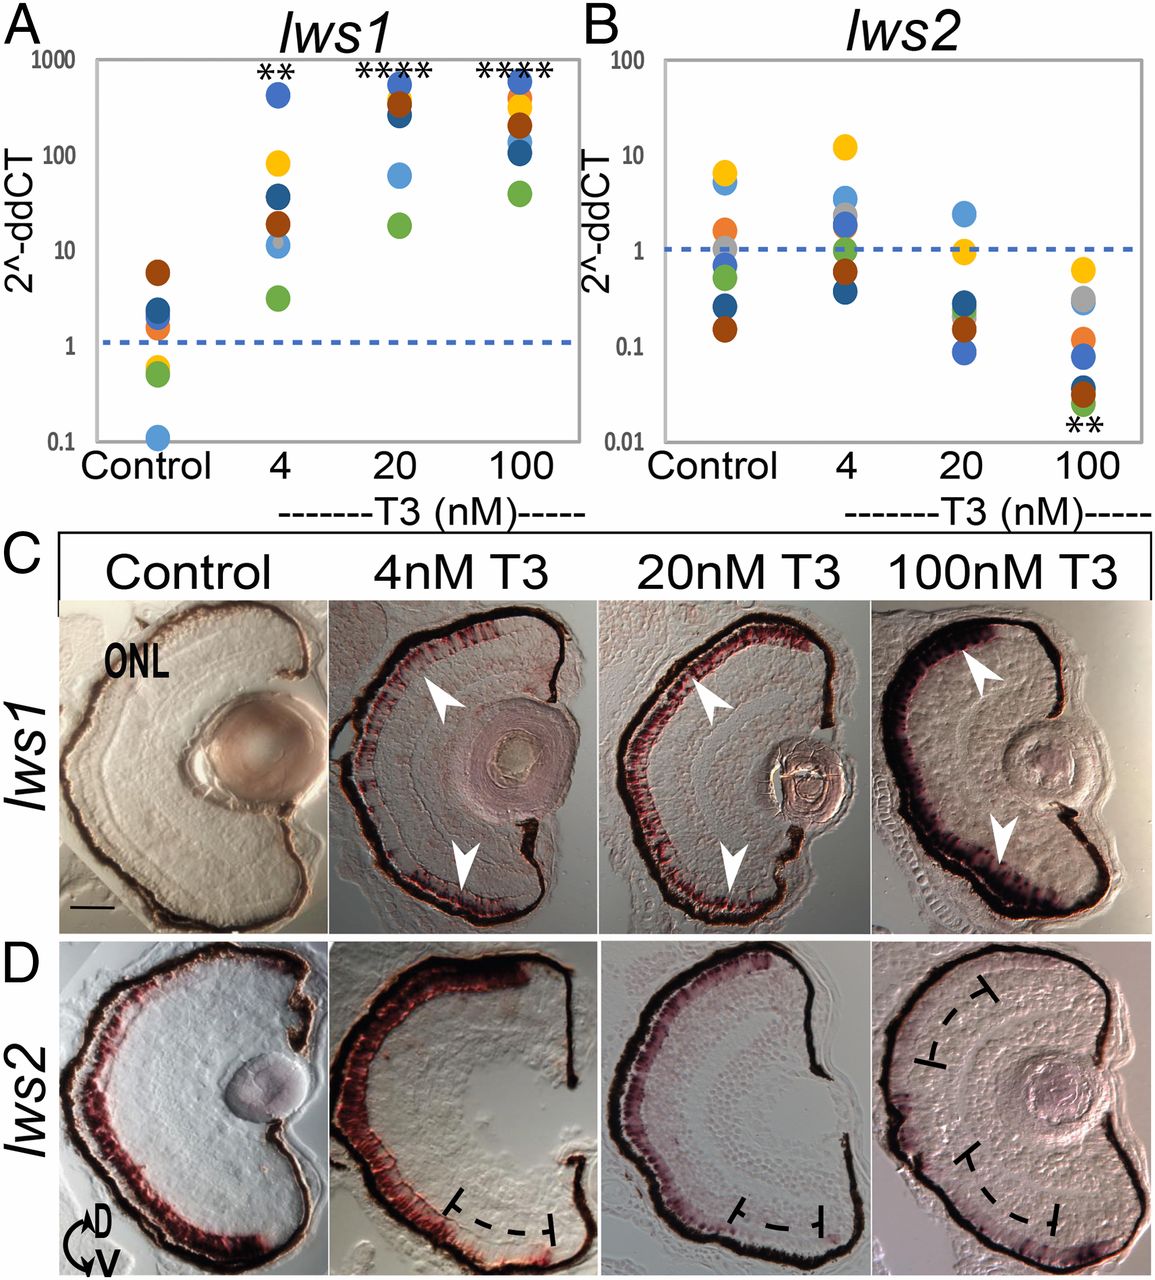
Fig. 1 qPCR and in situ hybridization for lws transcript abundance reveals robust differential regulation after TH (T3) treatment from 2 to 4 dpf. (A and B) Scatter plots indicate fold-change (2−ddCT) abundance of the indicated transcripts. Colors of dots correspond to separate experiments. Each dot represents 1 biological sample (pooled RNA from ∼5 larvae). For each condition n = 8 (A). lws1 abundance in DMSO control, increased by 4 nM T3 P = 0.001502, increased by 20 nM T3 P = 0.000003, increased by 100 nM T3 P = 0.000002. (B) lws2 abundance in control was unchanged by both 4 nM T3 and 20 nM T3 P = 0.288195 and P = 0.073120 but decreased by 100 nM T3 P = 0.004823. P values were calculated by comparing the ddCT values for treated vs. control from each experiment using the Kruskal–Wallis test and the Conover post hoc test further adjusted by the Benjamini–Hochberg false-discovery rate method. Statistical notation: **P < 0.01, ****P < 0.0001. (C and D) In situ hybridization of cryosectioned eyes using gene-specific probes for lws1 (C) and lws2 (D) from larvae treated 2 to 4 dpf with DMSO (control) or T3. Arrows in C indicate induced and expanded expression domain of lws1 due to T3 treatment; brackets in D indicate regions showing reduced expression of lws2 due to T3 treatment. D, dorsal; V, ventral. (Scale bar in C [applies to C and D], 50 μm.)