
- Title
-
Overexpression of Notch Signaling Induces Hyperosteogeny in Zebrafish
- Authors
- Liang, S.T., Chen, J.R., Tsai, J.J., Lai, Y.H., Hsiao, C.D.
- Source
- Full text @ Int. J. Mol. Sci.

ZFIN is incorporating published figure images and captions as part of an ongoing project. Figures from some publications have not yet been curated, or are not available for display because of copyright restrictions. EXPRESSION / LABELING:
PHENOTYPE:
|
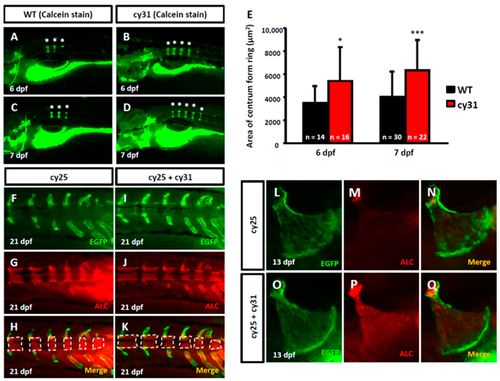
Evaluation of calcification in N1aICD-expressed transgenic zebrafish. (A–D) Calcein staining on wild type and Tg(Ola.Sp7:N1aICD)cy31 embryos at 7 days post-fertilization (dpf). The * indicates the formed column. (E) Quantification of calcification degree by calculating the area of ring centrum formation in the notochord. N represents the fish number used for analysis. (F,G,H) EGFP-expressed osteoblasts in green fluorescence, alizarin complexone (ALC) staining region and merged image in notochord of Tg(Ola.Sp7:EGFP)cy25 transgenic fish aged at 21 dpf. (I,J,K) N1aICD-expressed osteoblasts in green fluorescence, ALC staining region and merged image in notochord of double transgenic fish of Tg(Ola.Sp7:EGFP)cy25 and Tg(Ola.Sp7:N1aICD)cy31 at 21 dpf. The dashed line surrounded areas were measured using image quantitation and summed up for comparison. (L,M,N) EGFP-expressed osteoblasts in green fluorescence, ALC staining region and merged image in opercula of Tg(Ola.Sp7:EGFP)cy25 at 13 dpf. (O,P,Q) N1aICD-expressed osteoblasts in green fluorescence, ALC staining region and merged image in opercula of Tg(Ola.Sp7:EGFP)cy25 and Tg(Ola.Sp7:N1aICD)cy31 double transgenic fish at 13 dpf (averages ± SD; * p < 0.05; *** p < 0.005; n = fish number). EXPRESSION / LABELING:
PHENOTYPE:
|
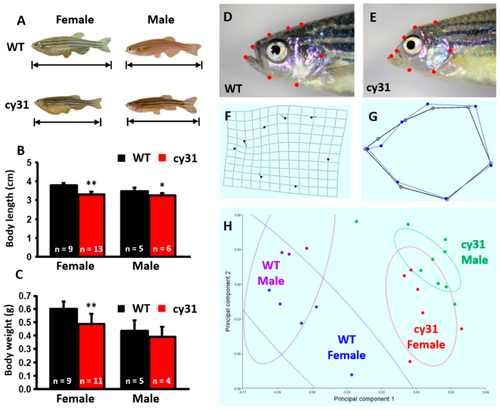
Morphological comparison between wild type and Tg(Ola.Sp7:N1aICD)cy31 adult fish. (A) Appearance of WT and Tg(Ola.Sp7:N1aICD)cy31 (cy31) transgenic fish in both genders aged 6 month old. (B,C) Statistical analysis and comparison of male/female body length (B) and body weight (C). (D–G) Morphometric analysis of the head in both WT and cy31 transgenic fish. (H) Principal component analysis (PCA) of WT and cy31 transgenic fish in both genders. Significance was tested by Student’s t-test and data were presented as averages ± SD (* p < 0.05; ** p < 0.01; n = fish number). PHENOTYPE:
|
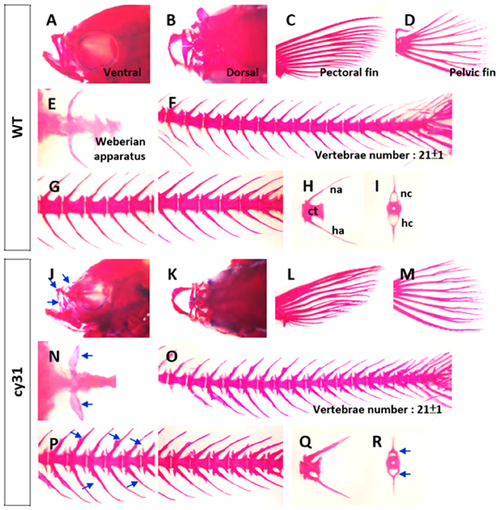
Alcian blue/Alizarin red double staining in different skeletal regions of wild type fish (A–I) and Tg(Ola.Sp7:N1aICD)cy31 transgenic fish (J–R). Bone morphologies of maxilla from lateral (A,J) and dorsal views (B,K), pectoral fin (C,L), pelvic fin (D,M), Weberian apparatus (E,N), vertebrae (F,O), and neural and hemal arches from lateral (H,Q) and anterior (I,R) views were magnified respectively. Blue arrows indicated the abnormal formation of outgrowing knots (centrum, ct; neural arch, na; hemal arch, ha; neural canal, nc; hemal canal, hc). PHENOTYPE:
|
|
ZFIN is incorporating published figure images and captions as part of an ongoing project. Figures from some publications have not yet been curated, or are not available for display because of copyright restrictions. PHENOTYPE:
|
|
ZFIN is incorporating published figure images and captions as part of an ongoing project. Figures from some publications have not yet been curated, or are not available for display because of copyright restrictions. PHENOTYPE:
|
|
ZFIN is incorporating published figure images and captions as part of an ongoing project. Figures from some publications have not yet been curated, or are not available for display because of copyright restrictions. |
|
ZFIN is incorporating published figure images and captions as part of an ongoing project. Figures from some publications have not yet been curated, or are not available for display because of copyright restrictions. EXPRESSION / LABELING:
|