
- Title
-
Using Zebrafish Larvae to Study the Pathological Consequences of Hemorrhagic Stroke
- Authors
- Crilly, S., Njegic, A., Parry-Jones, A.R., Allan, S.M., Kasher, P.R.
- Source
- Full text @ J. Vis. Exp.
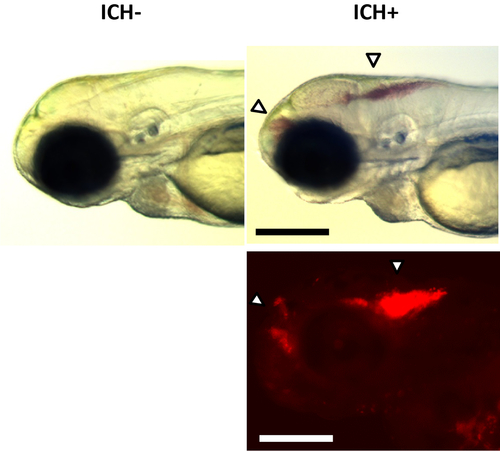
ICH+ brain hemorrhage phenotypes. Examples of larval ICH phenotypes maintained on a transgenic gata1:DsRed reporter nacre background observed with a brightfield stereomicroscope (top panels) and fluorescence (bottom panel) at ~48 h post-fertilization. No hemorrhages were observed in ICH-larvae (left panels). A distinct accumulation of red blood cells in the forebrain and hindbrain (arrows) were observed in ICH+ larvae (right panels). Scale bars represent 250 µm. Figure has been reproduced from Crilly et al.20 with permission under a Creative Commons license.
|
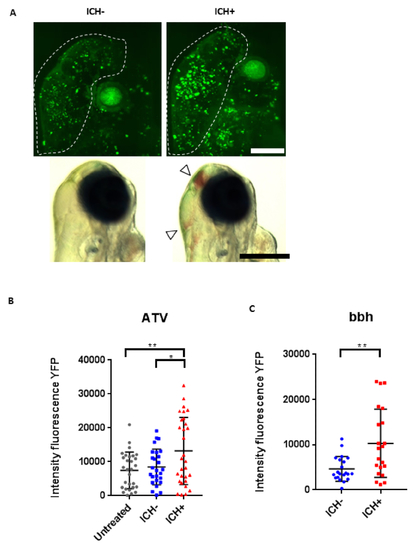
Intracerebral hemorrhage (ICH) in zebrafish larvae results in a quantifiable brain injury. (A) Representative images of the brain injury phenotype in ICH+ larvae (right panels), in comparison to ICH- siblings (left panels), at 72 hpf. Brightfield images (bottom panels, scale bar = 250 µm) demonstrate the presence of brain bleeds (arrows) in ICH+ larvae. Fluorescent microscopy was performed to visualize cell death in the ubiq:secAnnexinV-mVenus reporter line (top panels, scale bar = 100 µm). Clusters of dying cells were observed in peri-hematomal regions. Images were cropped to brain-only regions and analyzed for total green fluorescence intensity in round particles larger than 30 pixels in diameter (white line) using the macro in Supplementary File 1. (B) Quantification of fluorescence signal in the brains of untreated, ICH- and ICH+ larvae obtained through the ATV model (n = 12 per group; 3 independent replicates) at 72 hpf. Significant differences were observed when comparing ICH+ with untreated (**p = 0.004) and with ICH- (*p = 0.03) siblings. (C) Quantification of fluorescence signal as a read out for annexinV binding in the brains of ICH- and ICH+ larvae obtained through the bubblehead (bbh) model (n = 12 per group; 2 independent replicates) at 72 hpf. Graphs show SD from the mean. A significant difference in mVenus fluorescence was observed between ICH+ and ICH- age-matched siblings (**p = 0.002). Figure has been reproduced from Crilly et al.20with permission under a Creative Commons license.
|
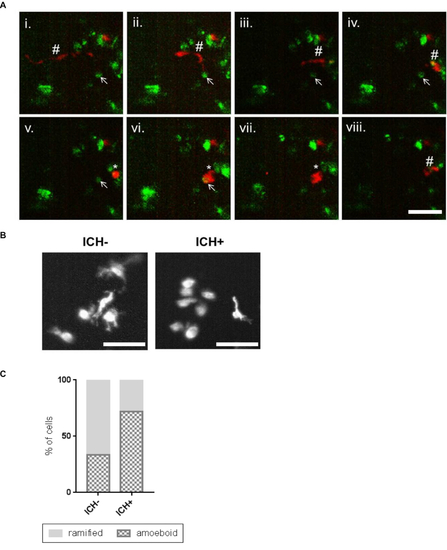
Activated macrophage cells show a phagocytic response to the brain lesion. (A) Representative time-lapse stills20 showing a ramified patrolling macrophage migrating towards an annexinV positive cell (i - vi). Stills are obtained from a series of images taken of the whole brain using a 20x objective. Scale bar represents 50 µm. The macrophage acquired an amoeboid morphology (v) before phagocytosing the annexinV-positive cell (vi, vii). After phagocytosis the macrophage resumes a ramified morphology and migrates away and the annexinV-positive cell can no longer be seen (viii). Ramified macrophage (#), annexinV positive cell (arrow), amoeboid macrophage (*) are indicated. (B) Representative images of mpeg1-positive cells in the ICH- and ICH+ larval brain exhibiting amoeboid and ramified morphologies. Scale bars represent 50 µm. (C) An increased proportion of amoeboid (phagocytic) and decreased proportion of ramified (inactive) macrophages was observed in ICH+ brains in comparison to ICH- siblings. Figure has been reproduced from Crilly et al.20 with permission under a Creative Commons license. |