FIGURE SUMMARY
Title

YB-1 recruitment to stress granules in zebrafish cells reveals a differential adaptive response to stress

Authors
Guarino, A.M., Mauro, G.D., Ruggiero, G., Geyer, N., Delicato, A., Foulkes, N.S., Vallone, D., CalabrĂ², V.
Source
Full text @ Sci. Rep.

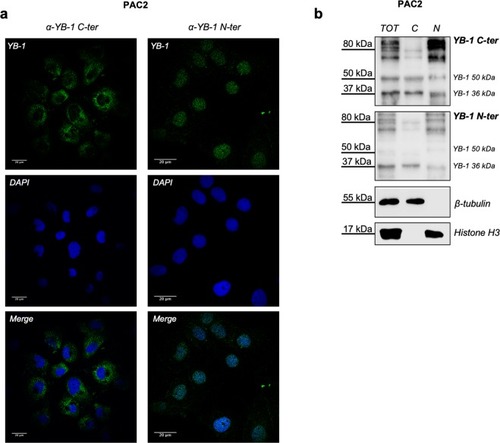
Immunoreactivity of human YB-1 antibodies against zebrafish YB-1. (a) confocal immunofluorescence analysis of PAC2 cells stained with human YB-1 antibodies (α-YB-1 C-ter and α-YB-1 N-ter), nuclei were stained with DAPI (blue); (b) western blot of PAC2 total (TOT), Cytoplasmic (C) and nuclear (N) protein extracts analysed with α-YB-1 N-ter and α-YB-1 C-ter antibodies; Histone H3 and ß-tubulin were used as loading controls for the nuclear and cytoplasmic extracts, respectively. Each panel is assembled from cropped western blotting images (see Supplementary Material file for the original images).

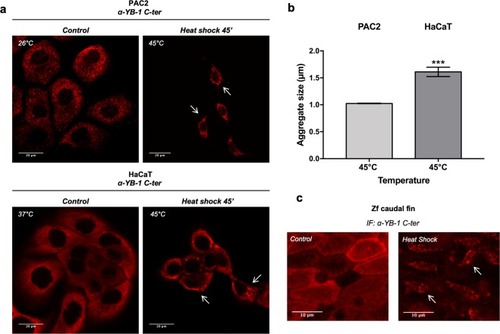
Heat shock promotes assembly of YB-1 positive aggregates in zebrafish and mammalian cells. (a) confocal immunofluorescence of PAC2 cells (upper panels) and HaCaT cells (lower panels) stained with human α-YB-1 C- ter antibody (red); some YB-1 aggregates are indicated by arrows; (b) quantification of YB-1 aggregate dimensions after heat shock at 45 °C for 45′ in PAC2 and HaCaT cells (unpaired t-test with Welch’s correction *p = 0.007, see also Table S1); (c) confocal immunofluorescence of adult zebrafish caudal fins at 26 °C (control) and after heat shock at 45 °C, stained with human α-YB-1 C-ter antibody. YB-1 aggregates are indicated by arrows.

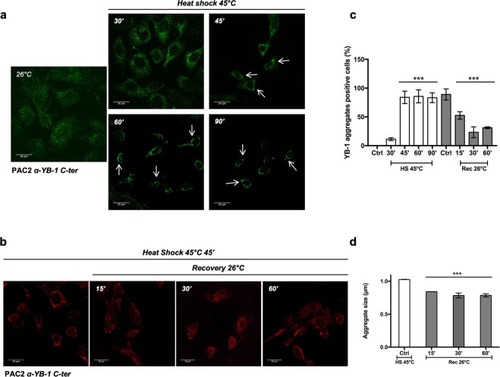
Kinetics of YB-1 aggregate formation. (a) confocal immunofluorescence of YB-1 (Green) in PAC2 cells at 26 °C (control) or after heat shock at 45 °C for the indicated times; (b) confocal immunofluorescence for YB-1(red) in PAC2 cells incubated at 45 °C for 45′ and then replaced at 26 °C for recovery from the heat shock at the indicated times; (c) percentage of cells forming YB-1 positive aggregates (plotted on the y-axes) incubated at 45 °C for the indicated times (white bars) and then allowed to recover for 15, 30 and 60 minutes at 26 °C (grey bars). Statistical analysis was performed using 1-way ANOVA and Dunnett’s multiple comparisons. Levels of significance are indicated (***p < 0.001) (see also Table S1); (d) quantification of YB-1 positive aggregate dimensions in PAC2 cells incubated at 45 °C for 45 minutes (white bar) and then allowed to recover at 26 °C for the indicated times (grey bars). Statistical analysis was performed using 1-way ANOVA and Dunnett’s multiple comparisons. Levels of significance are indicated (***p < 0.001) (see also Table S1).

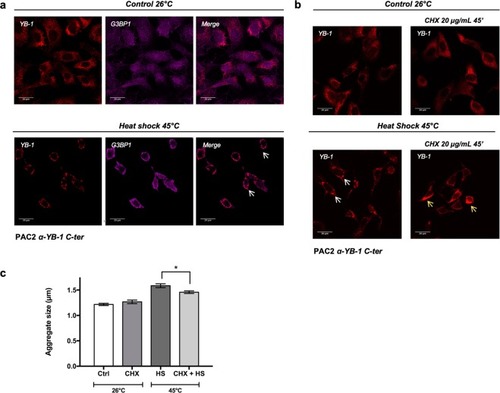
Heat shock induced YB-1 aggregates represent bona fide SGs. (a) Confocal immunofluorescence analysis of YB-1 (red) and G3BP1 (magenta) in PAC2 cells at 26 °C (control) or after heat shock at 45 °C for 45 minutes. Cellular colocalization is present in perinuclear aggregates indicated by white arrows; (b) confocal immunofluorescence of YB-1 in PAC2 cells treated with cycloheximide (20 µg/ml) at 26 °C (upper part of the panel) or after heat shock at 45 °C for 45 minutes (lower part of the panel). Controls are represented in the left part of the panel. White arrows indicate YB-1 positive aggregates (lower panel, left). Yellow arrows indicate the bulk of the protein not forming aggregates (lower panel, right); (c) quantification of YB-1 positive SG aggregate dimensions in PAC2 cells documented in the cycloheximide treatment analysis presented in panel b. Statistical analysis was performed using 1-way ANOVA followed by Tukey’s multiple comparisons test. Levels of significance are indicated (*p = 0.05) (see also Table S1).

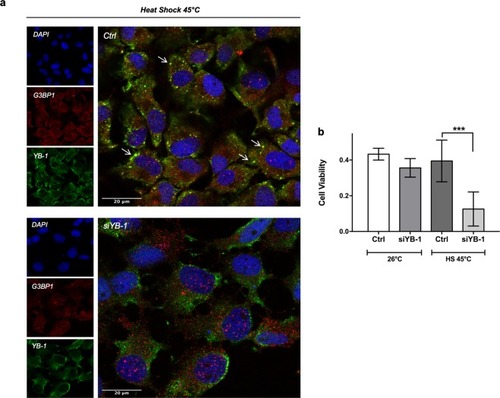
YB-1 is essential for SG formation and PAC2 cell viability upon thermal stress. (a) Confocal immunofluorescence analysis of G3BP1 (red) and YB-1 (green) in control (upper panel) and YB-1-silenced PAC2 cells (lower panel) after heat shock treatment (45 minutes at 45 °C). Nuclei were stained with DAPI (blue) and both single and merged images are presented. White arrows indicate SGs; (b) cell viability assay (MTT) in control or YB-1-silenced PAC2 cells at 26 °C or after heat shock (45 minutes at 45 °C). Statistical analysis was performed using 1-way ANOVA followed by Tukey’s multiple comparisons test. Levels of significance are indicated (***p 0.001) (see also Table S1).

Acknowledgments
This image is the copyrighted work of the attributed author or publisher, and ZFIN has permission only to display this image to its users. Additional permissions should be obtained from the applicable author or publisher of the image. Full text @ Sci. Rep.