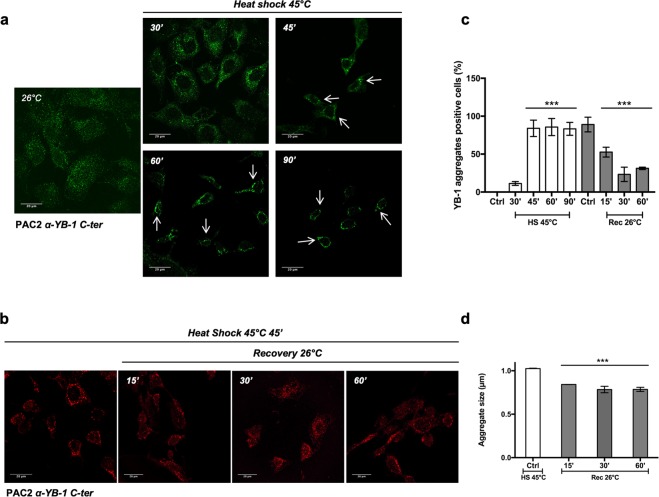
IMAGE

Figure 4

ID
ZDB-IMAGE-190723-415
Source
Figures for Guarino et al., 2019
Image
Figure Caption

Figure 4

Kinetics of YB-1 aggregate formation. (a) confocal immunofluorescence of YB-1 (Green) in PAC2 cells at 26 °C (control) or after heat shock at 45 °C for the indicated times; (b) confocal immunofluorescence for YB-1(red) in PAC2 cells incubated at 45 °C for 45′ and then replaced at 26 °C for recovery from the heat shock at the indicated times; (c) percentage of cells forming YB-1 positive aggregates (plotted on the y-axes) incubated at 45 °C for the indicated times (white bars) and then allowed to recover for 15, 30 and 60 minutes at 26 °C (grey bars). Statistical analysis was performed using 1-way ANOVA and Dunnett’s multiple comparisons. Levels of significance are indicated (***p < 0.001) (see also Table S1); (d) quantification of YB-1 positive aggregate dimensions in PAC2 cells incubated at 45 °C for 45 minutes (white bar) and then allowed to recover at 26 °C for the indicated times (grey bars). Statistical analysis was performed using 1-way ANOVA and Dunnett’s multiple comparisons. Levels of significance are indicated (***p < 0.001) (see also Table S1).

Acknowledgments
This image is the copyrighted work of the attributed author or publisher, and ZFIN has permission only to display this image to its users. Additional permissions should be obtained from the applicable author or publisher of the image. Full text @ Sci. Rep.