
- Title
-
Multicolor lineage tracing using in vivo time-lapse imaging reveals coordinated death of clonally related cells in the developing vertebrate brain
- Authors
- Brockway, N.L., Cook, Z.T., O'Gallagher, M., Tobias, Z.J.C., Gedi, M., Carey, K.M., Unni, V.K., Pan, Y.A., Metz, M.R., Weissman, T.A.
- Source
- Full text @ Dev. Biol.
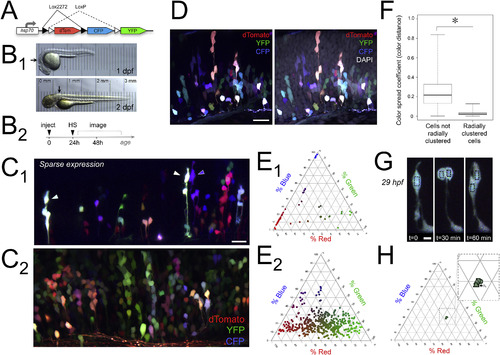
Brainbow labels clonally related clusters of dividing cells in the developing zebrafish hindbrain. A) Schematic of hsp:Zebrabow (Brainbow) DNA transiently expressed to color-code clones. B1) In vivo transmitted light images of developing zebrafish at 1 and 2 dpf; arrows indicate general hindbrain region targeted for imaging. Translucency of embryo is demonstrated by micrometer placed below each fish. B2) Experimental timeline showing injections at one-cell stage, heat shock (HS) at 24 h, and imaging from 1 to 3 dpf. C) In vivo Brainbow expression in the hindbrain, shown in maximum intensity projections representing 41μm in sparsely labeled 51 hpf zebrafish (C1), and 81μm in 63.5 hpf zebrafish (C2). In all panels, dorsal is up and rostral is to the left. D) DAPI staining of Brainbow-expressing zebrafish fixed at 51 hpf shows non-labeled cells for calculating labeling density; DAPI staining is coded as white for display (maximum intensity projection representing 3.4μm). E) Color of cells in C1 and C2 is quantified as relative channel weights in corresponding ternary plots (n=54 cells; 461 cells). F) Color spread coefficient, or distance between two colors, is significantly smaller between cells that are radially clustered. Coefficient values were obtained from pairwise comparisons between cells in hindbrain shown in C2 (n=360 cells). Whiskers show extremes of data while an asterisk indicates a significant difference in color spread coefficient (Welch Two Sample t-test, t(648.66)=170.59, p < 2.2 x 10⁻¹⁶). G) Cell color remains relatively constant in daughter cells following cell division. Series of time points showing in vivo mitotic event in hindbrain of 29 hpf Brainbow-labeled zebrafish over 1 h (maximum intensity projections, 30μm depth). Color of mother and daughter cells, indicated by black boxes in G, is represented as relative channel weights in ternary plot in H; inset shows zoom of same plot to allow viewing of tightly clustered cell colors (M is mother; D1 and D2 are daughters at 30 min/squares, and 60 min/triangles). Scale bars represent 20μm in C1, 16μm in C2, 20μm in D, and 5μm in G. In C, D, and G, dTomato is coded as red, YFP is coded as green, and CFP is coded as blue. |

Time-lapse in vivo imaging combined with Brainbow color-coding distinguishes multiple neighboring clones of cells undergoing interkinetic nuclear migration and dividing. A) Color-coded radial clusters labeled in one fish expressing Brainbow at 2 dpf (55 hpf; A1) and 3 dpf (71 hpf; A2); maximum intensity projections representing 62μm and 47μm respectively. Three color-coded radial clusters are identified with arrowheads at each time point. The color of all Brainbow-labeled cells in A1 and A2is quantified as relative channel weights in the corresponding ternary plots in B1 and B2 (n=106 cells, 119 cells). C) Zebrafish hindbrain at 35 hpf labeled with Brainbow (maximum intensity projection showing 24μm); inset indicated with dashed white box is the first time point displayed in D. D) Series of time points taken at 30 min intervals in the hindbrain from C. Over period of 9.5 h shown, labeled cells underwent interkinetic nuclear migration; white arrowheads indicate a cell at the apical surface. Rounding up of the cell soma at the apical surface and a corresponding increase in clone number (e.g., red cell at 5.5h and then 8h) was considered a mitotic event. E) Dorsolateral view of zebrafish hindbrain at 30.5 hpf labeled with Brainbow, where white dashed-and-dotted line shows approximate boundary of head, and white dashed box indicates inset shown in first time point of F. F) Series of time points taken at 30 min intervals in the hindbrain from E. Over a period of 1.5 h, two blue cells indicated by the white arrowheads can be observed moving to the apical surface and undergoing mitosis, suggesting a clone containing two progenitor cells. Scale bar represents 20μm in A, 25μm in C, and 20μm in F. In A through D, dorsal is up and rostral is to the left. In E and F, rostral is to the left. In all images, dTomato is coded as red, YFP is coded as green, and CFP is coded as blue. |

Cells within dividing clones in the ventricular zone undergo coordinated death in vivo. A) Zebrafish hindbrain at 31 hpf labeled with Brainbow (maximum intensity projection representing 36μm). White dashed box indicates inset shown in the first time point in B. B) Series of time points showing hindbrain in A at 30-min intervals. White arrowhead in first panel shows lavender cell that will undergo apoptosis in subsequent panels, indicated by cell fragmentation followed by gradual clearance of apoptotic bodies. Neighboring labeled cells appeared healthy throughout. Dorsal is up and rostral is to the left. C) Dorsal view of 29 hpf zebrafish hindbrain labeled with Brainbow; transmitted light channel shows the morphology of hindbrain and ventricle, overlaid with maximum intensity projection of Brainbow-labeled clones representing 165μm. Rostral is up. White dashed box indicates region shown zoomed and rotated in D. D) Series of time points of hindbrain from C taken at 30 min intervals (maximum intensity projections of 30μm). Over a period of 8h, the purple clone can be observed first undergoing mitosis (indicated by white arrowheads), before undergoing progressive whole-clone apoptosis (apoptotic events indicated by white “X”). Throughout this stepwise apoptotic process, nearby labeled cells appear healthy. Rostral is to the right. Scale bar represents 20μm in B, 30μm in C and 20μm in D. E) Number of cell deaths from in vivo time-lapse movies, categorized as isolated cell death, partial-clone apoptosis, or whole-clone apoptosis (n=30 deaths). The majority of deaths observed (19/30) are clonal. F) Mean time elapsed between mitosis and apoptosis, for isolated cell deaths (n=6 cells from 3 fish) and the first death in clonal apoptosis sequence (n=4 cells from 3 fish); error bars represent standard deviation; p < 0.05. In all Brainbow images, dTomato is coded as red, YFP is coded as green, and CFP is coded as blue. |
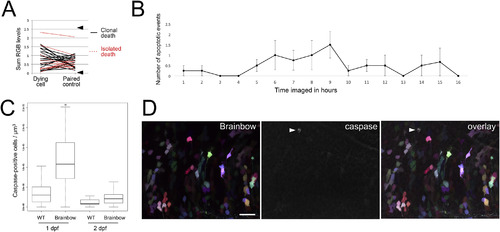
Brainbow expression does not cause clonal apoptosis. A) The brightness of cells that undergo apoptosis paired with the brightest neighboring control cell; brightness is quantified by summed relative RGB value (range of 0 to 3; n=30 cells/condition from 4 fish). Solid black lines represent brightness differences when the dying cell is part of a clonal apoptosis event and dashed red lines represent cases in which the dying cell is an isolated death. Arrowheads show the overall range of healthy control cells in the same tissue. B) Mean number of apoptotic events observed in hindbrain over time imaged; error bars represent standard error of the mean; n=4 fish. C) Quantified activated caspase-positive cells in fish expressing Brainbow following injection and heat shock, and in uninjected, wild-type fish at both 1 dpf (Brainbow: n=23 fish, WT: n=16 fish) and 2 dpf (Brainbow: n=29 fish, WT: n=40 fish). Whiskers represent extremes of data. D) 48 hpf zebrafish hindbrain expressing Brainbow (maximum intensity projection of 29μm); caspase staining is coded as white for display. Dorsal is up and rostral is to the left; scale bar represents 20μm. In D, dTomato is coded as red, YFP is coded as green, and CFP is coded as blue. |
Reprinted from Developmental Biology, 453(2), Brockway, N.L., Cook, Z.T., O'Gallagher, M., Tobias, Z.J.C., Gedi, M., Carey, K.M., Unni, V.K., Pan, Y.A., Metz, M.R., Weissman, T.A., Multicolor lineage tracing using in vivo time-lapse imaging reveals coordinated death of clonally related cells in the developing vertebrate brain, 130-140, Copyright (2019) with permission from Elsevier. Full text @ Dev. Biol.