
|
Fig. 1
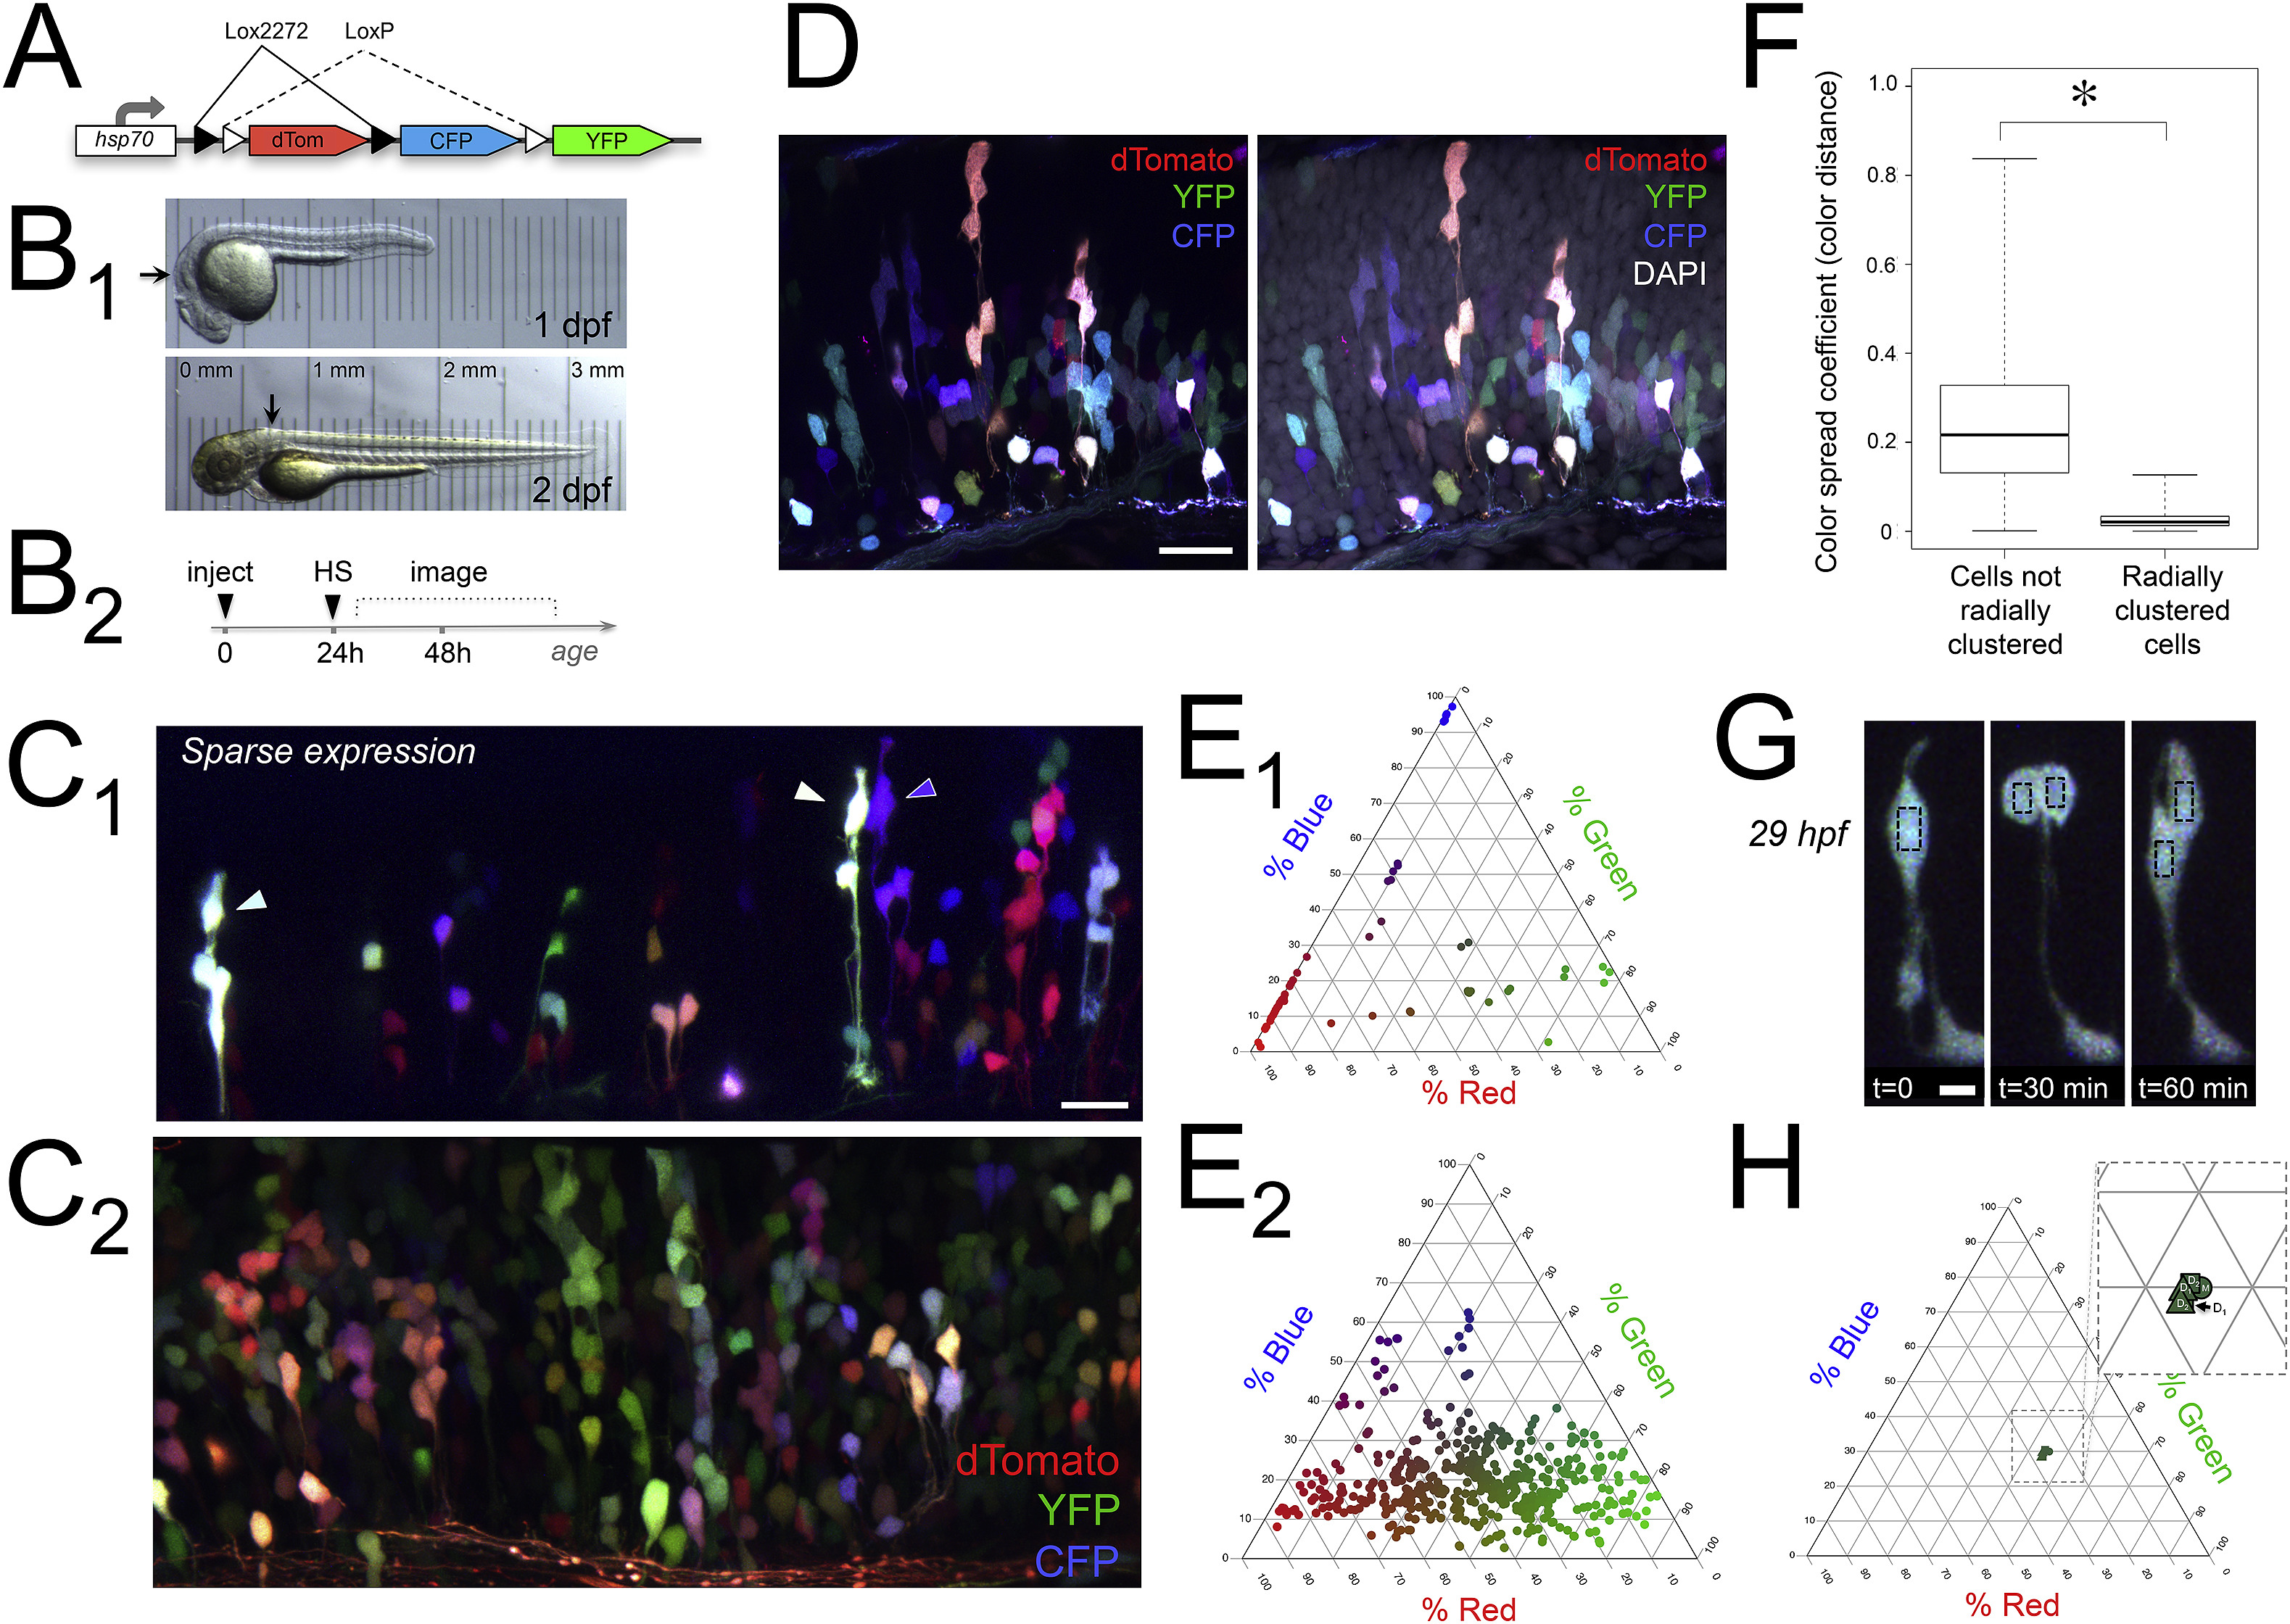
Brainbow labels clonally related clusters of dividing cells in the developing zebrafish hindbrain.
A) Schematic of hsp:Zebrabow (Brainbow) DNA transiently expressed to color-code clones. B1) In vivo transmitted light images of developing zebrafish at 1 and 2 dpf; arrows indicate general hindbrain region targeted for imaging. Translucency of embryo is demonstrated by micrometer placed below each fish. B2) Experimental timeline showing injections at one-cell stage, heat shock (HS) at 24 h, and imaging from 1 to 3 dpf. C) In vivo Brainbow expression in the hindbrain, shown in maximum intensity projections representing 41μm in sparsely labeled 51 hpf zebrafish (C1), and 81μm in 63.5 hpf zebrafish (C2). In all panels, dorsal is up and rostral is to the left. D) DAPI staining of Brainbow-expressing zebrafish fixed at 51 hpf shows non-labeled cells for calculating labeling density; DAPI staining is coded as white for display (maximum intensity projection representing 3.4μm). E) Color of cells in C1 and C2 is quantified as relative channel weights in corresponding ternary plots (n=54 cells; 461 cells). F) Color spread coefficient, or distance between two colors, is significantly smaller between cells that are radially clustered. Coefficient values were obtained from pairwise comparisons between cells in hindbrain shown in C2 (n=360 cells). Whiskers show extremes of data while an asterisk indicates a significant difference in color spread coefficient (Welch Two Sample t-test, t(648.66)=170.59, p < 2.2 x 10⁻¹⁶). G) Cell color remains relatively constant in daughter cells following cell division. Series of time points showing in vivo mitotic event in hindbrain of 29 hpf Brainbow-labeled zebrafish over 1 h (maximum intensity projections, 30μm depth). Color of mother and daughter cells, indicated by black boxes in G, is represented as relative channel weights in ternary plot in H; inset shows zoom of same plot to allow viewing of tightly clustered cell colors (M is mother; D1 and D2 are daughters at 30 min/squares, and 60 min/triangles). Scale bars represent 20μm in C1, 16μm in C2, 20μm in D, and 5μm in G. In C, D, and G, dTomato is coded as red, YFP is coded as green, and CFP is coded as blue.
Reprinted from Developmental Biology, 453(2), Brockway, N.L., Cook, Z.T., O'Gallagher, M., Tobias, Z.J.C., Gedi, M., Carey, K.M., Unni, V.K., Pan, Y.A., Metz, M.R., Weissman, T.A., Multicolor lineage tracing using in vivo time-lapse imaging reveals coordinated death of clonally related cells in the developing vertebrate brain, 130-140, Copyright (2019) with permission from Elsevier. Full text @ Dev. Biol.